SOM cluster: 2320
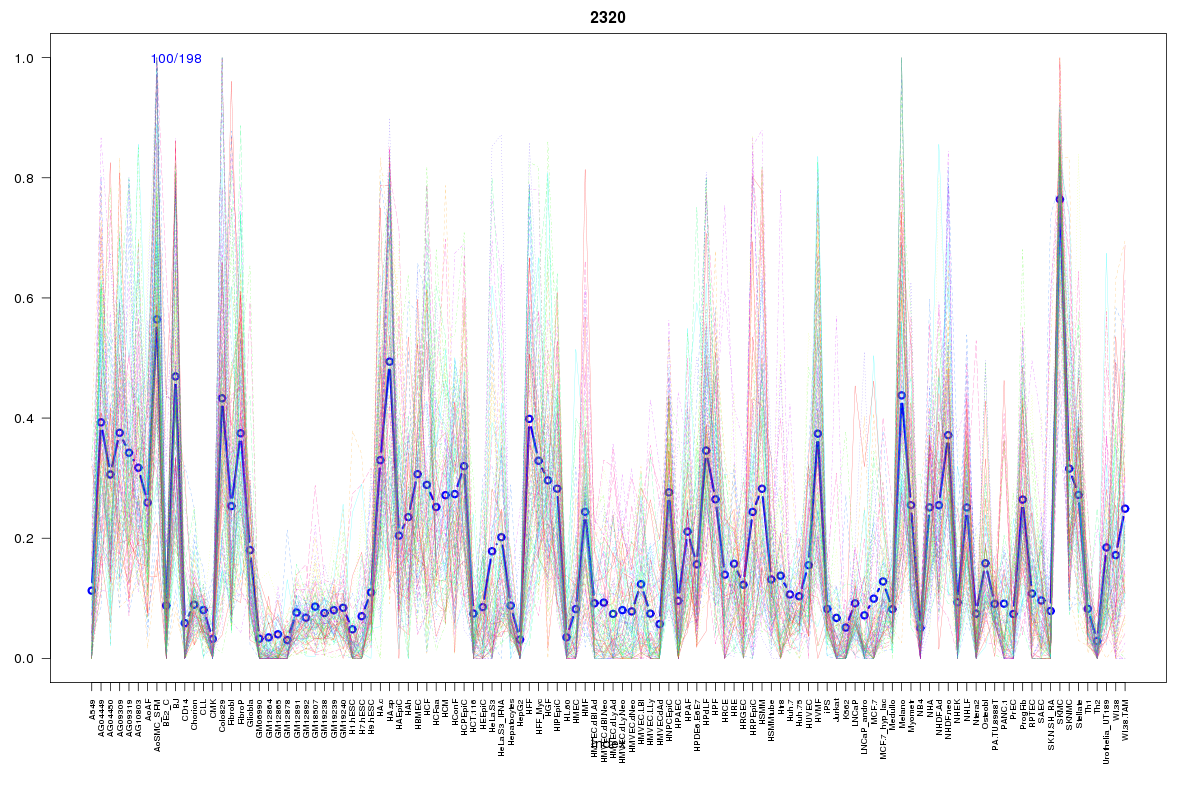
Cluster Hypersensitivity Profile

Genomic Location Trend
These plots show the distribution of the DHS sites surrounding the Transcript Start Site of the nearest gene.
Stats
Number of sites: 198Promoter: 4%
CpG-Island: 0%
Conserved: 67%
Enriched Motifs & Matches
Match Detail: [Jaspar]
|
| ||
|---|---|---|
| Sites: 71/100 | e-val: 0.000000000000023 | ||
| Factor | e-val(match) | DB |
| Lhx3 | 0.00029228 | JASPAR |
| HNF1A | 0.00045883 | JASPAR |
| MEF2A | 0.0023675 | JASPAR |
| Pou5f1 | 0.0038192 | JASPAR |
| Foxd3 | 0.0086709 | JASPAR |
|
| ||
| Sites: 19/100 | e-val: 0.00055 | ||
| Factor | e-val(match) | DB |
| SPIB | 0.0002431 | JASPAR |
| Foxd3 | 0.00027553 | JASPAR |
| NFATC2 | 0.0094545 | JASPAR |
| FOXI1 | 0.010166 | JASPAR |
| EWSR1-FLI1 | 0.012815 | JASPAR |
BED file downloads
Top 10 Example Regions
| Location | Gene Link | Dist. |
|---|---|---|
| chr8: 38756540-38756690 | ADAM9 | 37.02 |
| chr8: 38756540-38756690 | CTD-2544N14.3 | 37.02 |
| chr8: 38756540-38756690 | TM2D2 | 37.02 |
| chr8: 38756540-38756690 | RP11-723D22.3 | 37.02 |
| chr8: 38756540-38756690 | PLEKHA2 | 37.02 |
| chr8: 38756540-38756690 | RP11-723D22.2 | 37.02 |
| chr8: 18836820-18836970 | SNORA62 | 37.59 |
| chr1: 156771120-156771270 | ISG20L2 | 52.19 |
| chr1: 156771120-156771270 | CRABP2 | 52.19 |
| chr1: 156771120-156771270 | RRNAD1 | 52.19 |