SOM cluster: 2282
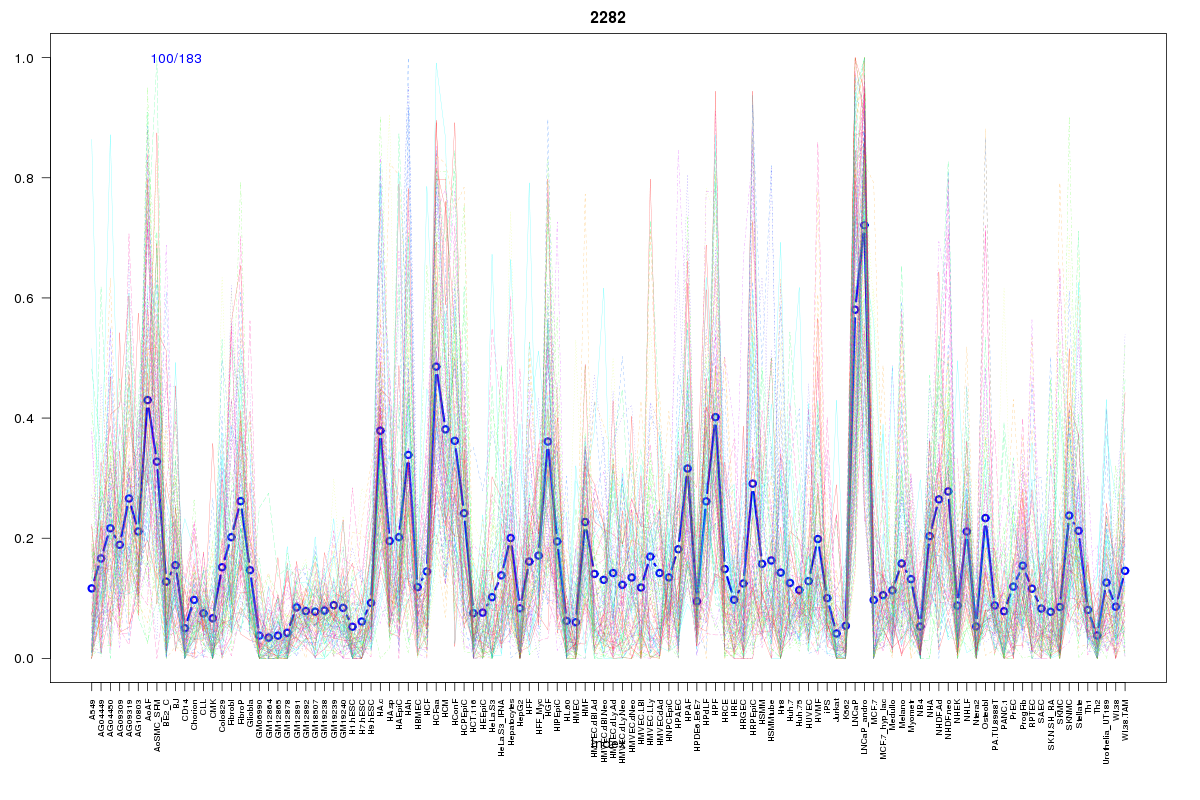
Cluster Hypersensitivity Profile

Genomic Location Trend
These plots show the distribution of the DHS sites surrounding the Transcript Start Site of the nearest gene.
Stats
Number of sites: 183Promoter: 0%
CpG-Island: 2%
Conserved: 52%
Enriched Motifs & Matches
Match Detail: [Jaspar]
|
| ||
|---|---|---|
| Sites: 47/100 | e-val: 1.1e-18 | ||
| Factor | e-val(match) | DB |
| TLX1::NFIC | 0.0000000000013595 | JASPAR |
| NFIC | 0.0063503 | JASPAR |
| znf143 | 0.0088041 | JASPAR |
| Hand1::Tcfe2a | 0.012139 | JASPAR |
| EWSR1-FLI1 | 0.018978 | JASPAR |
BED file downloads
Top 10 Example Regions
| Location | Gene Link | Dist. |
|---|---|---|
| chr1: 794080-794230 | RP11-206L10.2 | 36.48 |
| chr1: 794080-794230 | FAM41C | 36.48 |
| chr1: 167868720-167868870 | DCAF6 | 46.65 |
| chr1: 167868720-167868870 | RP1-313L4.3 | 46.65 |
| chr16: 69213865-69214015 | SNTB2 | 54.29 |
| chr16: 69213865-69214015 | HAS3 | 54.29 |
| chr8: 120904820-120904970 | DEPTOR | 54.95 |
| chr9: 80911105-80911255 | PSAT1 | 55.69 |
| chr14: 21714780-21714930 | CTD-2552B11.2 | 68.96 |
| chr16: 16187240-16187390 | ABCC1 | 71.72 |