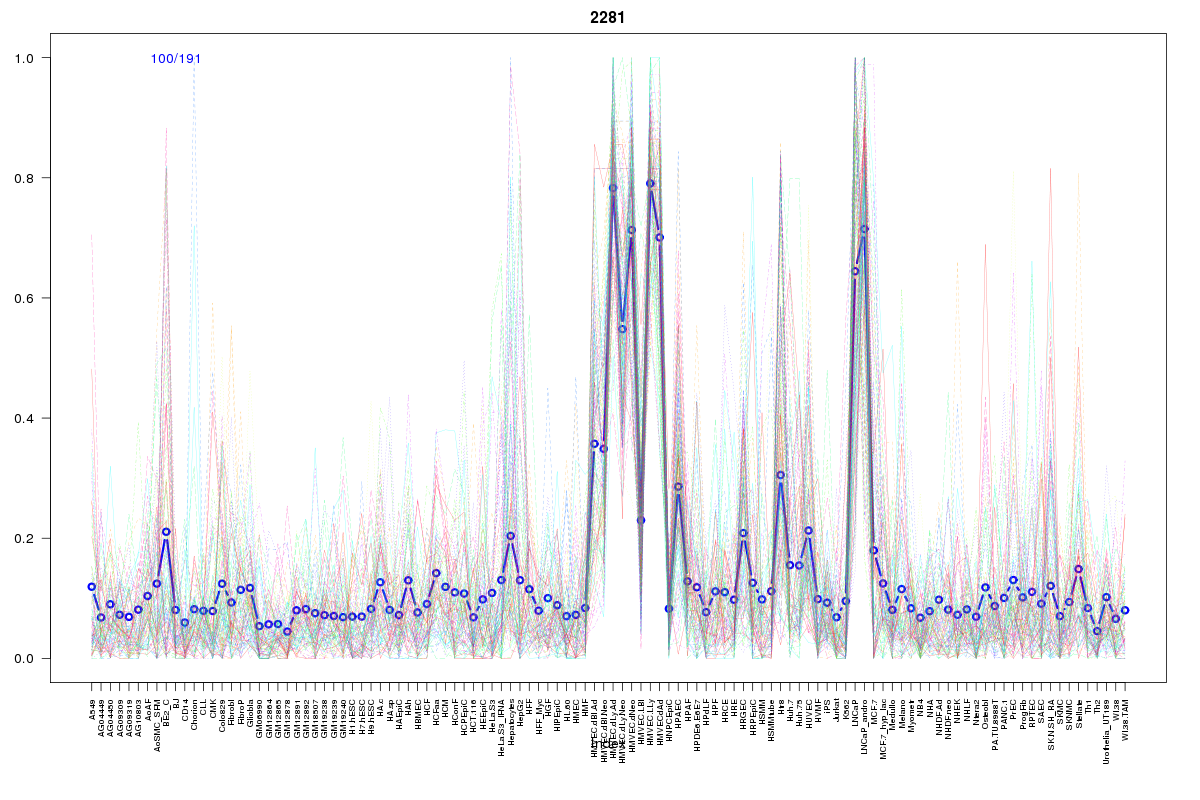
SOM cluster: 2281
Cluster Hypersensitivity Profile

Genomic Location Trend
These plots show the distribution of the DHS sites surrounding the Transcript Start Site of the nearest gene.
Stats
Number of sites: 191Promoter: 4%
CpG-Island: 1%
Conserved: 45%
Enriched Motifs & Matches
Match Detail: [Jaspar]
|
| ||
|---|---|---|
| Sites: 26/100 | e-val: 1.1e-16 | ||
| Factor | e-val(match) | DB |
| Foxa2 | 0.00000000017929 | JASPAR |
| FOXA1 | 0.0000000025591 | JASPAR |
| FOXF2 | 0.0000007199 | JASPAR |
| Foxd3 | 0.00000082163 | JASPAR |
| FOXI1 | 0.0000051309 | JASPAR |
BED file downloads
Top 10 Example Regions
| Location | Gene Link | Dist. |
|---|---|---|
| chr3: 37976640-37976790 | CTDSPL | 45.57 |
| chr3: 37976640-37976790 | VILL | 45.57 |
| chr8: 19613920-19614070 | CSGALNACT1 | 51.32 |
| chr8: 19613920-19614070 | RP11-1105O14.1 | 51.32 |
| chr1: 208137305-208137455 | CD34 | 55.36 |
| chr9: 72000500-72000650 | APBA1 | 55.78 |
| chr9: 72000500-72000650 | FAM189A2 | 55.78 |
| chr3: 195633180-195633330 | TNK2 | 56.19 |
| chr3: 195633180-195633330 | TNK2-AS1 | 56.19 |
| chr17: 1251000-1251150 | TUSC5 | 61.35 |