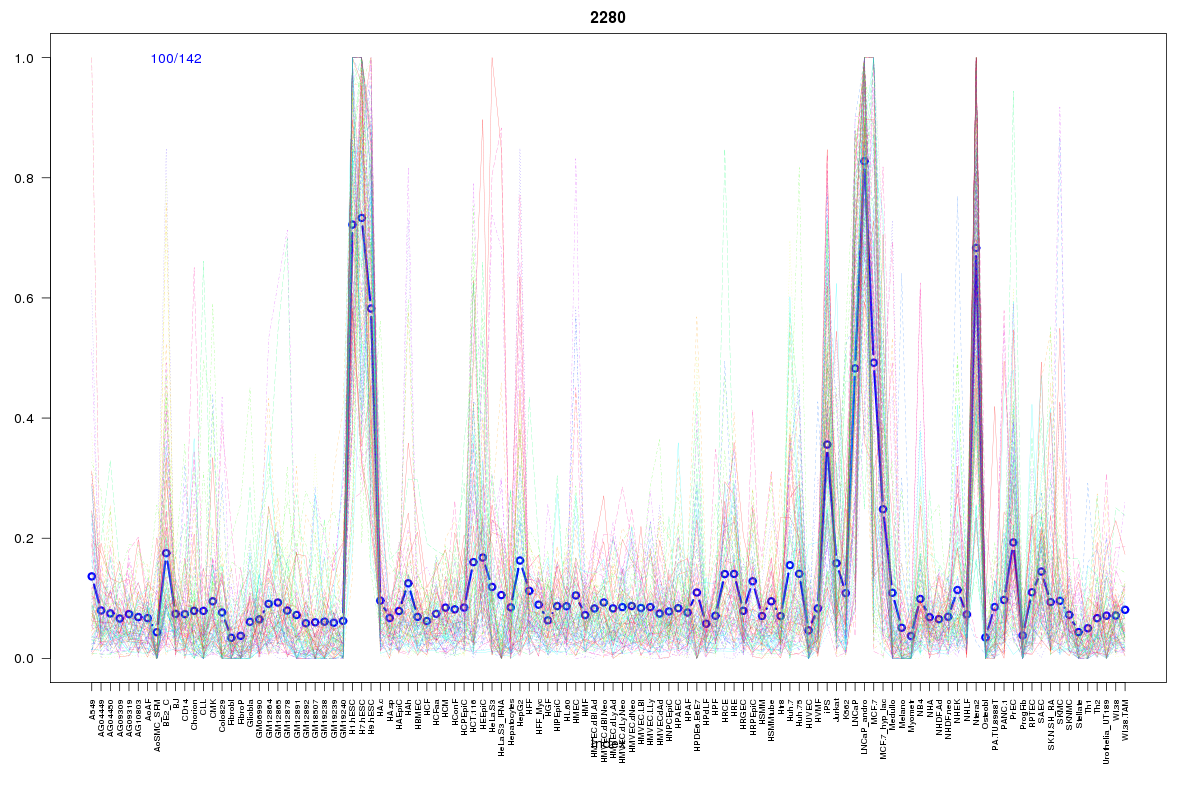
SOM cluster: 2280
Cluster Hypersensitivity Profile

Genomic Location Trend
These plots show the distribution of the DHS sites surrounding the Transcript Start Site of the nearest gene.
Stats
Number of sites: 142Promoter: 9%
CpG-Island: 4%
Conserved: 46%
Enriched Motifs & Matches
Match Detail: [Jaspar]
|
| ||
|---|---|---|
| Sites: 16/100 | e-val: 0.13 | ||
| Factor | e-val(match) | DB |
| EWSR1-FLI1 | 0.00000028778 | JASPAR |
| SP1 | 0.000014962 | JASPAR |
| SPI1 | 0.00001755 | JASPAR |
| FEV | 0.0014977 | JASPAR |
| Stat3 | 0.0036359 | JASPAR |
BED file downloads
Top 10 Example Regions
| Location | Gene Link | Dist. |
|---|---|---|
| chr10: 99096840-99096990 | FRAT2 | 38.29 |
| chr11: 61462500-61462650 | DAGLA | 57.91 |
| chr11: 58694980-58695130 | GLYATL1 | 62.46 |
| chr3: 53778500-53778650 | CHDH | 66.48 |
| chr1: 232220700-232220850 | RP5-865N13.2 | 67.78 |
| chr1: 232220700-232220850 | RP5-865N13.1 | 67.78 |
| chr15: 93180300-93180450 | FAM174B | 81.07 |
| chr17: 77809960-77810110 | CBX2 | 81.87 |
| chr2: 208977840-208977990 | CRYGA | 87.31 |
| chr2: 208977840-208977990 | AC093698.4 | 87.31 |