SOM cluster: 2278
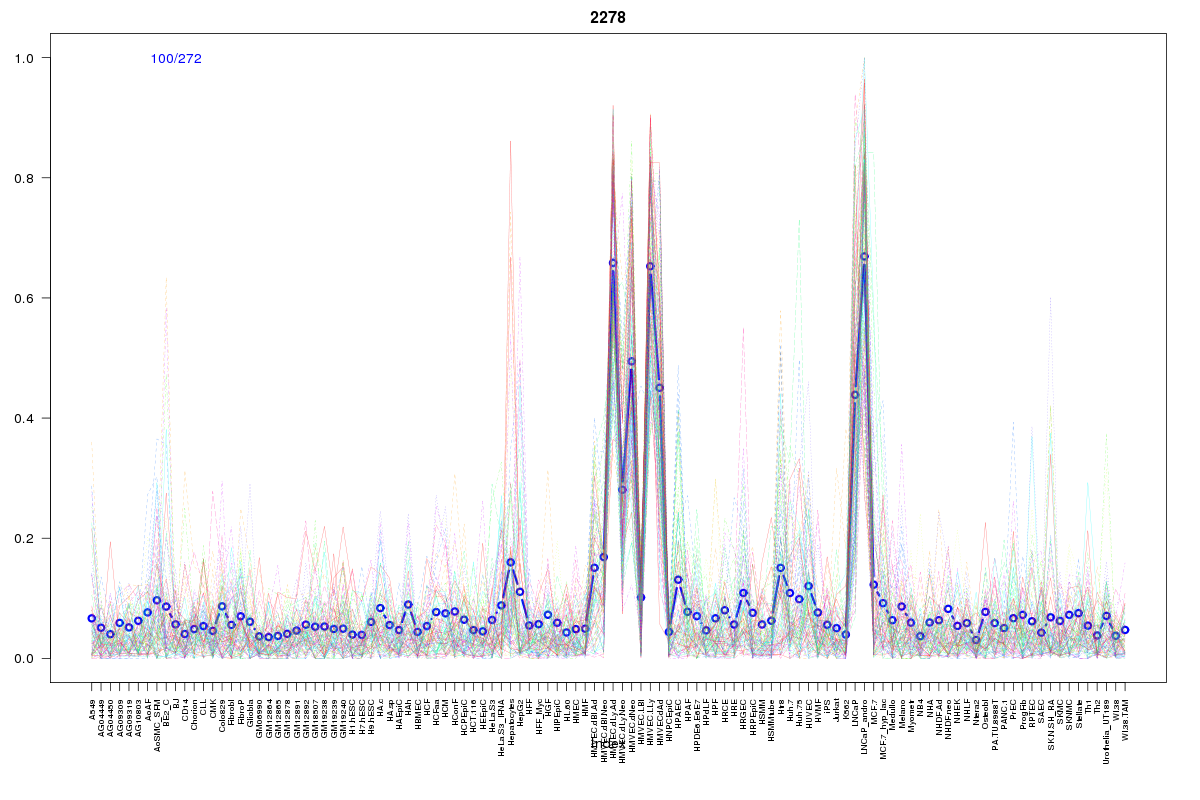
Cluster Hypersensitivity Profile

Genomic Location Trend
These plots show the distribution of the DHS sites surrounding the Transcript Start Site of the nearest gene.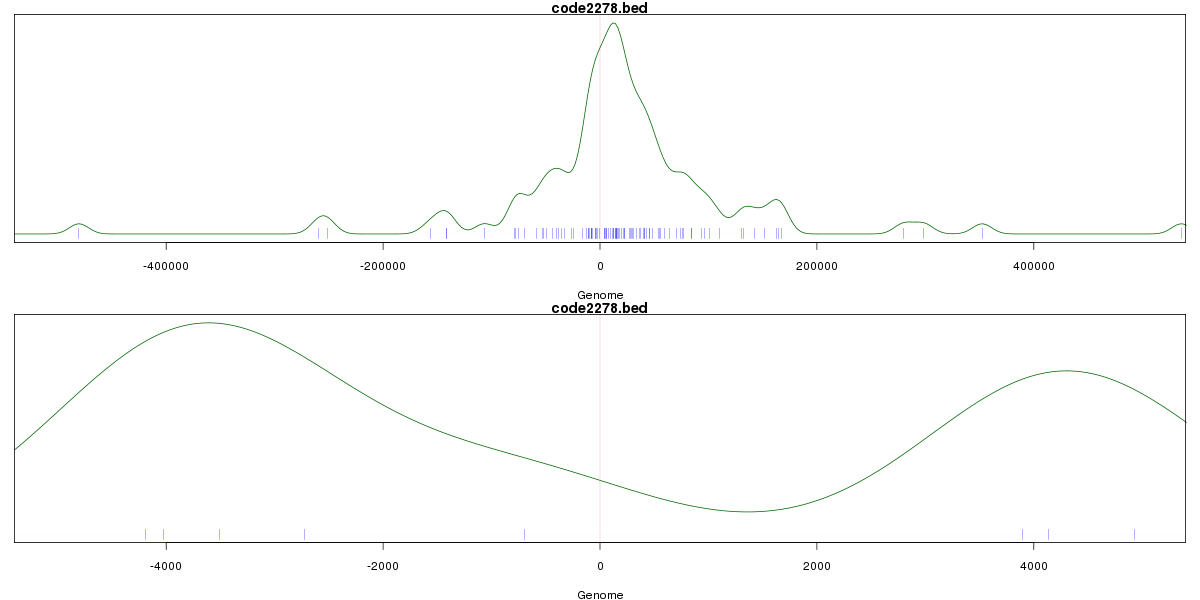
Stats
Number of sites: 272Promoter: 1%
CpG-Island: 0%
Conserved: 43%
Enriched Motifs & Matches
Match Detail: [Jaspar]
|
| ||
|---|---|---|
| Sites: 41/100 | e-val: 7.4e-17 | ||
| Factor | e-val(match) | DB |
| Foxd3 | 0.000000041053 | JASPAR |
| FOXI1 | 0.0000015737 | JASPAR |
| Foxa2 | 0.0000016889 | JASPAR |
| FOXA1 | 0.0000051817 | JASPAR |
| NFIC | 0.00049185 | JASPAR |
BED file downloads
Top 10 Example Regions
| Location | Gene Link | Dist. |
|---|---|---|
| chr8: 6321260-6321410 | ANGPT2 | 27.22 |
| chrX: 62502080-62502230 | SPIN4 | 48.59 |
| chr17: 30999020-30999170 | MYO1D | 54.74 |
| chr1: 10822040-10822190 | CASZ1 | 54.98 |
| chr22: 38177460-38177610 | TRIOBP | 63.34 |
| chr22: 38177460-38177610 | GALR3 | 63.34 |
| chr22: 38177460-38177610 | H1F0 | 63.34 |
| chr22: 38177460-38177610 | NOL12 | 63.34 |
| chr2: 169510180-169510330 | CERS6 | 64.53 |
| chr13: 27238040-27238190 | WASF3 | 66.68 |