SOM cluster: 2273
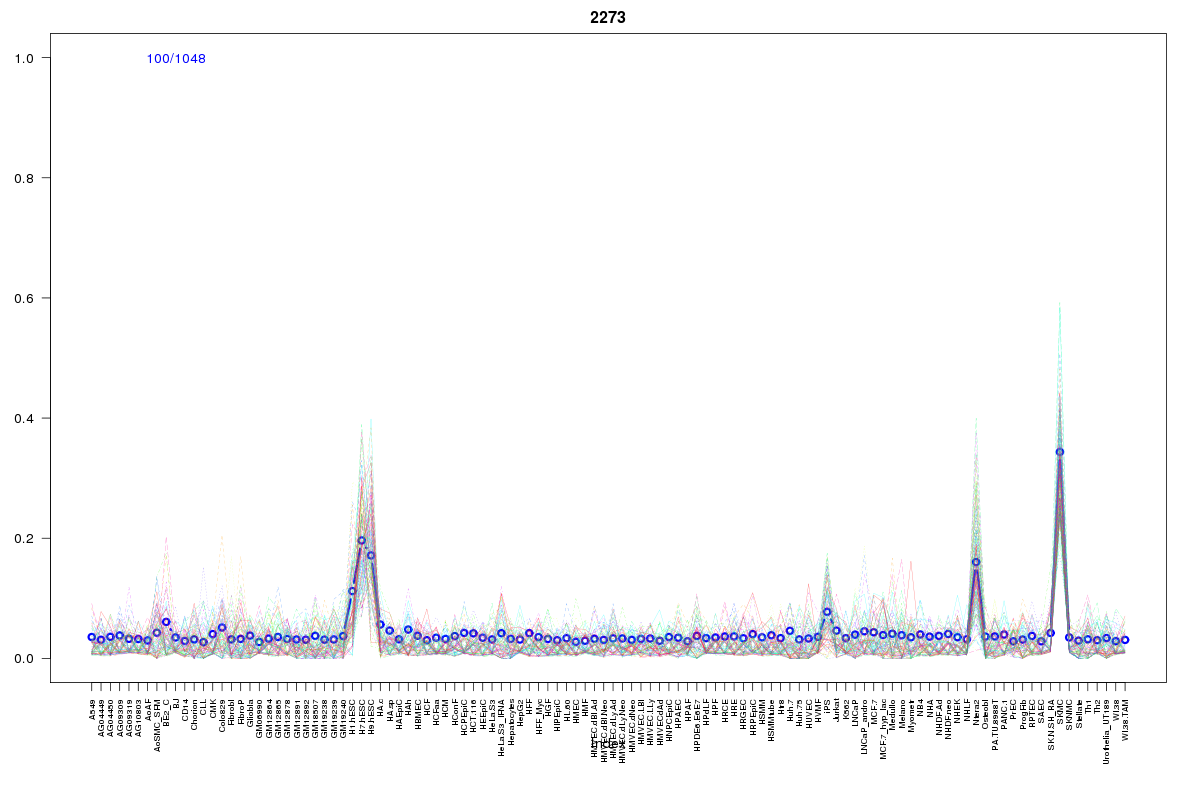
Cluster Hypersensitivity Profile

Genomic Location Trend
These plots show the distribution of the DHS sites surrounding the Transcript Start Site of the nearest gene.
Stats
Number of sites: 1048Promoter: 0%
CpG-Island: 0%
Conserved: 31%
Enriched Motifs & Matches
Match Detail: [Jaspar]
|
| ||
|---|---|---|
| Sites: 19/100 | e-val: 0.3 | ||
| Factor | e-val(match) | DB |
| EWSR1-FLI1 | 0.0000000064626 | JASPAR |
| IRF1 | 0.0031569 | JASPAR |
| SPI1 | 0.0042334 | JASPAR |
| SOX10 | 0.0068942 | JASPAR |
| NFATC2 | 0.011783 | JASPAR |
BED file downloads
Top 10 Example Regions
| Location | Gene Link | Dist. |
|---|---|---|
| chr12: 93945040-93945190 | RN7SL737P | 58.06 |
| chr12: 93945040-93945190 | MRPL42 | 58.06 |
| chr7: 39963900-39964050 | AC004987.9 | 59.21 |
| chr2: 70531605-70531755 | TIA1 | 61.93 |
| chr2: 70531605-70531755 | AC022201.5 | 61.93 |
| chr5: 118218540-118218690 | CTC-448D22.1 | 63.54 |
| chr17: 46270080-46270230 | CBX1 | 63.61 |
| chr3: 139149400-139149550 | ACTG1P1 | 65.48 |
| chr8: 70891700-70891850 | PRDM14 | 67.68 |
| chr1: 242387840-242387990 | PLD5 | 67.69 |