SOM cluster: 2271
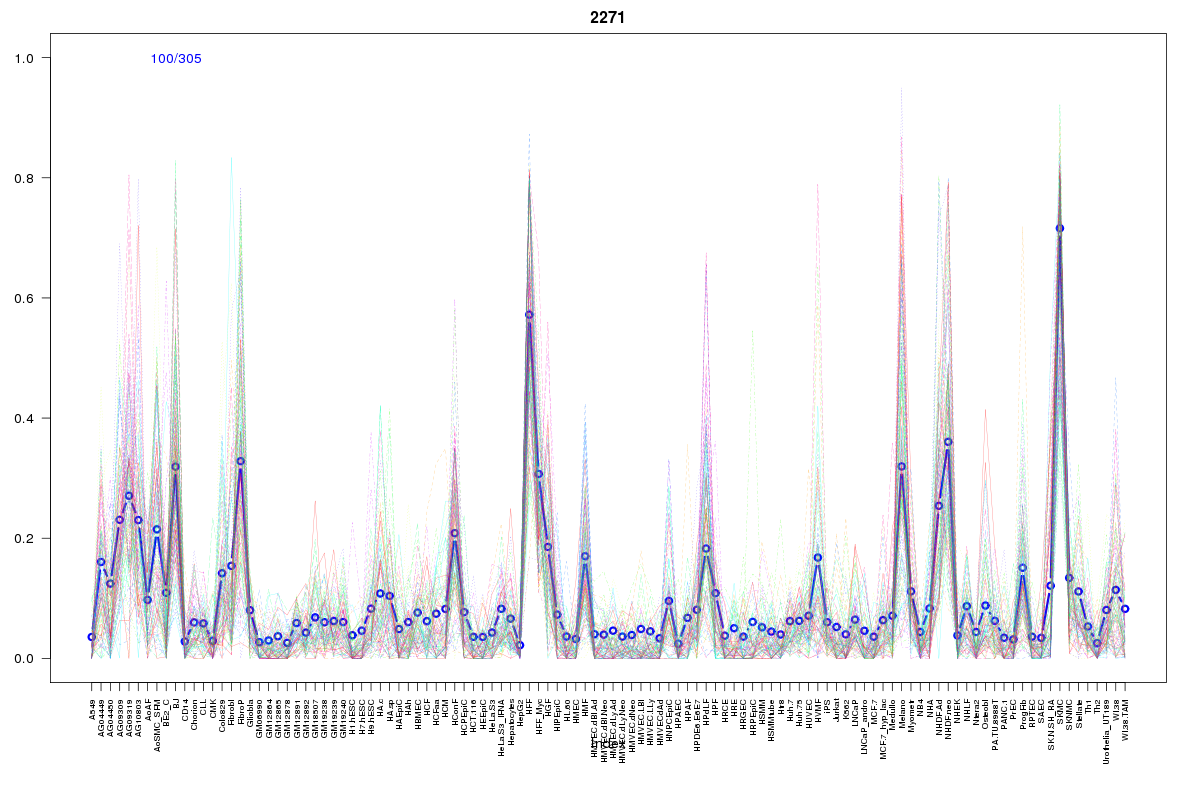
Cluster Hypersensitivity Profile

Genomic Location Trend
These plots show the distribution of the DHS sites surrounding the Transcript Start Site of the nearest gene.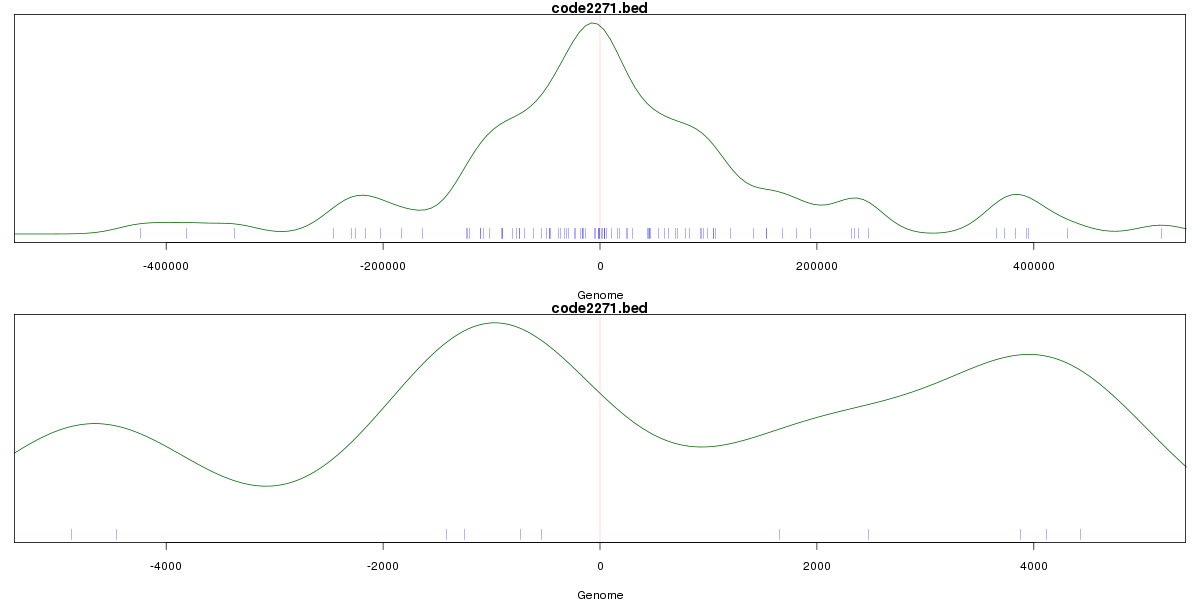
Stats
Number of sites: 305Promoter: 4%
CpG-Island: 0%
Conserved: 63%
Enriched Motifs & Matches
Match Detail: [Jaspar]
|
| ||
|---|---|---|
| Sites: 70/100 | e-val: 0 | ||
| Factor | e-val(match) | DB |
| TAL1::TCF3 | 0.000065853 | JASPAR |
| ARID3A | 0.000076896 | JASPAR |
| Prrx2 | 0.00012131 | JASPAR |
| HNF1A | 0.00038211 | JASPAR |
| Lhx3 | 0.00047921 | JASPAR |
BED file downloads
Top 10 Example Regions
| Location | Gene Link | Dist. |
|---|---|---|
| chr19: 10589280-10589430 | PDE4A | 53.7 |
| chr19: 10589280-10589430 | AP1M2 | 53.7 |
| chr5: 174270960-174271110 | NIFKP2 | 59.46 |
| chr8: 120591460-120591610 | RP11-99I9.2 | 61.86 |
| chr8: 120591460-120591610 | ENPP2 | 61.86 |
| chr3: 151697800-151697950 | RP11-454C18.2 | 65.63 |
| chr2: 202746180-202746330 | CDK15 | 70.5 |
| chr1: 10785000-10785150 | CASZ1 | 70.75 |
| chr8: 97596440-97596590 | SDC2 | 72.56 |
| chr5: 52864820-52864970 | FST | 73.92 |