SOM cluster: 2264
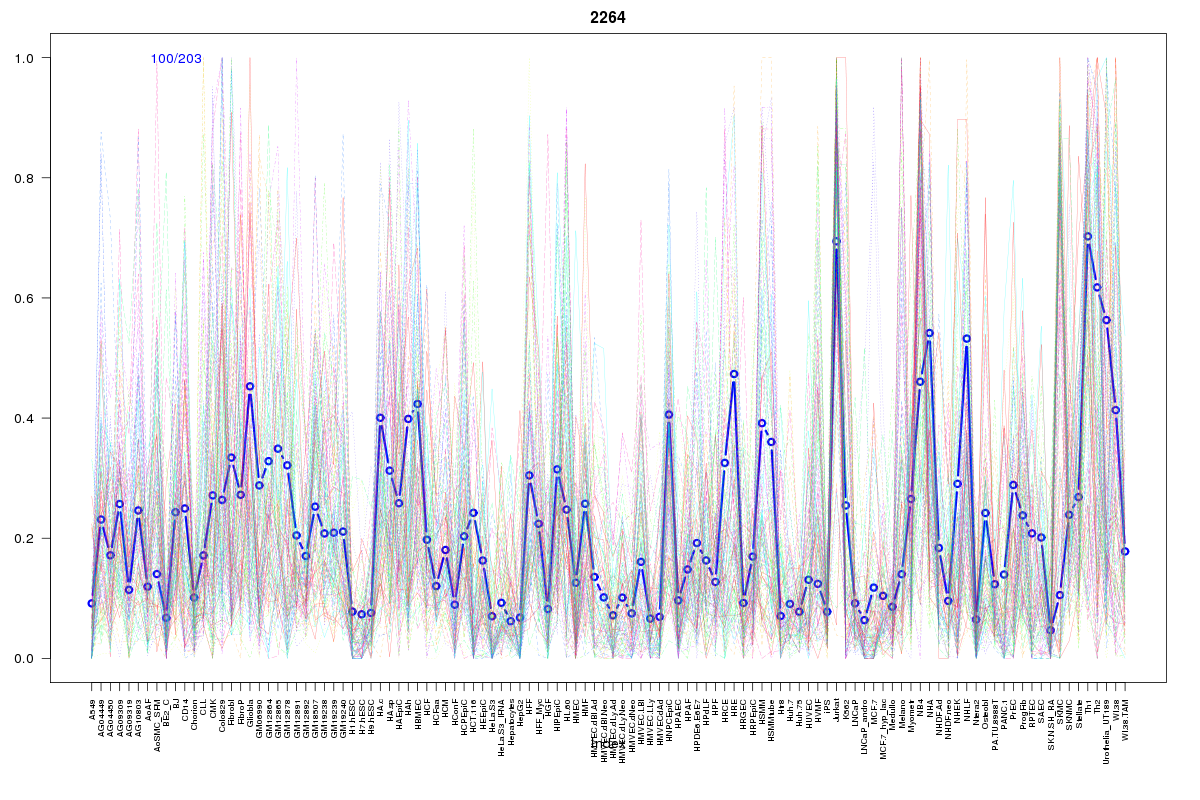
Cluster Hypersensitivity Profile

Genomic Location Trend
These plots show the distribution of the DHS sites surrounding the Transcript Start Site of the nearest gene.
Stats
Number of sites: 203Promoter: 5%
CpG-Island: 0%
Conserved: 46%
Enriched Motifs & Matches
Match Detail: [Jaspar]
|
| ||
|---|---|---|
| Sites: 35/100 | e-val: 0.0000000000000063 | ||
| Factor | e-val(match) | DB |
| RUNX1 | 0.00000034666 | JASPAR |
| RREB1 | 0.00043748 | JASPAR |
| ZNF354C | 0.0017664 | JASPAR |
| Tcfcp2l1 | 0.0059812 | JASPAR |
| MYC::MAX | 0.01319 | JASPAR |
|
| ||
| Sites: 26/100 | e-val: 0.0000000018 | ||
| Factor | e-val(match) | DB |
| SPI1 | 0.000000014104 | JASPAR |
| FEV | 0.00000012128 | JASPAR |
| EWSR1-FLI1 | 0.000028054 | JASPAR |
| ELF5 | 0.000054984 | JASPAR |
| GABPA | 0.000055717 | JASPAR |
BED file downloads
Top 10 Example Regions
| Location | Gene Link | Dist. |
|---|---|---|
| chr1: 53878960-53879110 | LRP8 | 45.84 |
| chr7: 148397920-148398070 | CUL1 | 46.35 |
| chr7: 148397920-148398070 | C7orf33 | 46.35 |
| chr19: 610980-611130 | HCN2 | 51.97 |
| chr1: 19275020-19275170 | IFFO2 | 53.8 |
| chr15: 95828240-95828390 | CTD-2536I1.1 | 55.89 |
| chr15: 101860940-101861090 | SNRPA1 | 57.57 |
| chr8: 8729960-8730110 | RP11-62H7.2 | 59.28 |
| chr8: 8729960-8730110 | MFHAS1 | 59.28 |
| chr17: 55520660-55520810 | MSI2 | 60.41 |