SOM cluster: 226
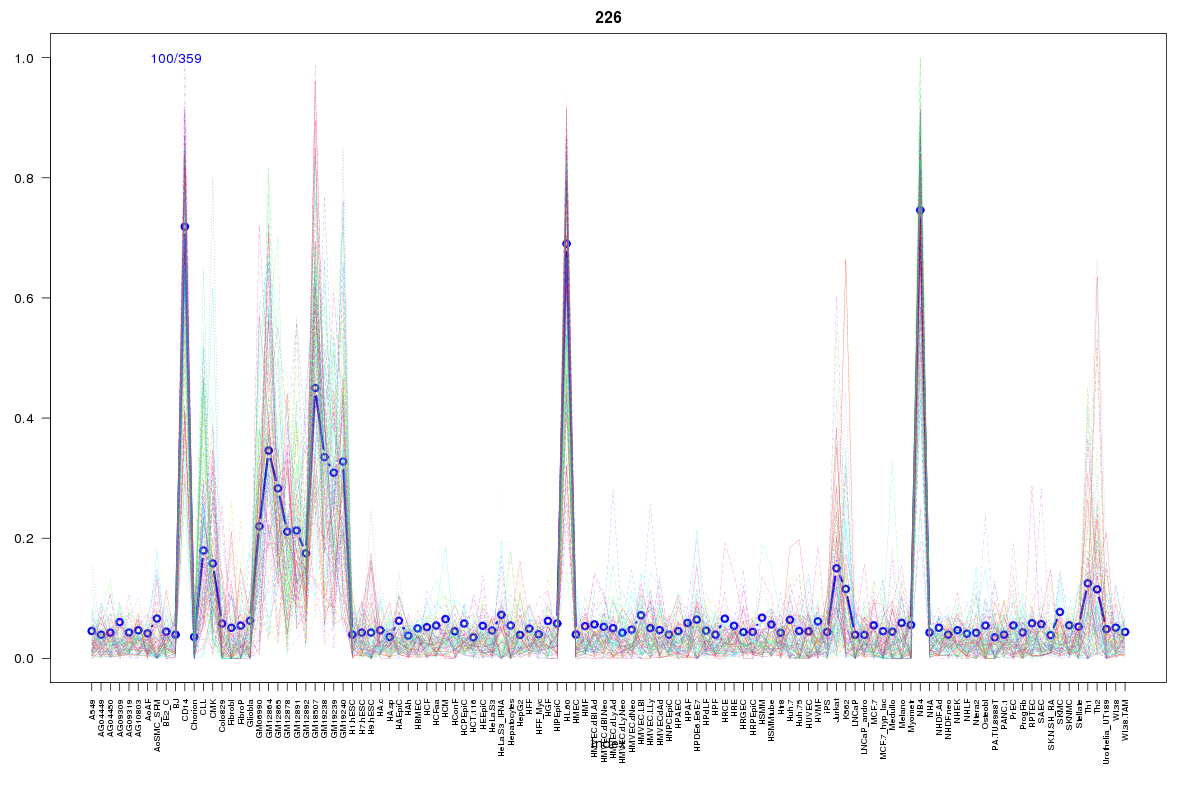
Cluster Hypersensitivity Profile

Genomic Location Trend
These plots show the distribution of the DHS sites surrounding the Transcript Start Site of the nearest gene.
Stats
Number of sites: 359Promoter: 2%
CpG-Island: 0%
Conserved: 33%
Enriched Motifs & Matches
Match Detail: [Jaspar]
|
| ||
|---|---|---|
| Sites: 53/100 | e-val: 5.30001e-40 | ||
| Factor | e-val(match) | DB |
| SPI1 | 0.000000020652 | JASPAR |
| SPIB | 0.0000020013 | JASPAR |
| FEV | 0.000067834 | JASPAR |
| GABPA | 0.00040581 | JASPAR |
| ELF5 | 0.00042738 | JASPAR |
|
| ||
| Sites: 11/100 | e-val: 0.096 | ||
| Factor | e-val(match) | DB |
| Tal1::Gata1 | 0.000043701 | JASPAR |
| Pax4 | 0.000072351 | JASPAR |
| SP1 | 0.00017658 | JASPAR |
| EWSR1-FLI1 | 0.00051581 | JASPAR |
| MZF1_1-4 | 0.0019719 | JASPAR |
BED file downloads
Top 10 Example Regions
| Location | Gene Link | Dist. |
|---|---|---|
| chr1: 90406780-90406930 | LRRC8D | 32.79 |
| chr7: 36824780-36824930 | ELMO1 | 42.35 |
| chr4: 48229760-48229910 | TEC | 45.87 |
| chr1: 117546260-117546410 | CD101 | 46.13 |
| chr13: 99934080-99934230 | GPR18 | 46.62 |
| chr13: 99934080-99934230 | GPR183 | 46.62 |
| chr12: 117115260-117115410 | RP11-497G19.1 | 47.04 |
| chr1: 3594220-3594370 | TPRG1L | 49.76 |
| chr1: 3594220-3594370 | RP5-1092A11.5 | 49.76 |
| chr8: 12615200-12615350 | OR7E15P | 51.55 |