SOM cluster: 2249
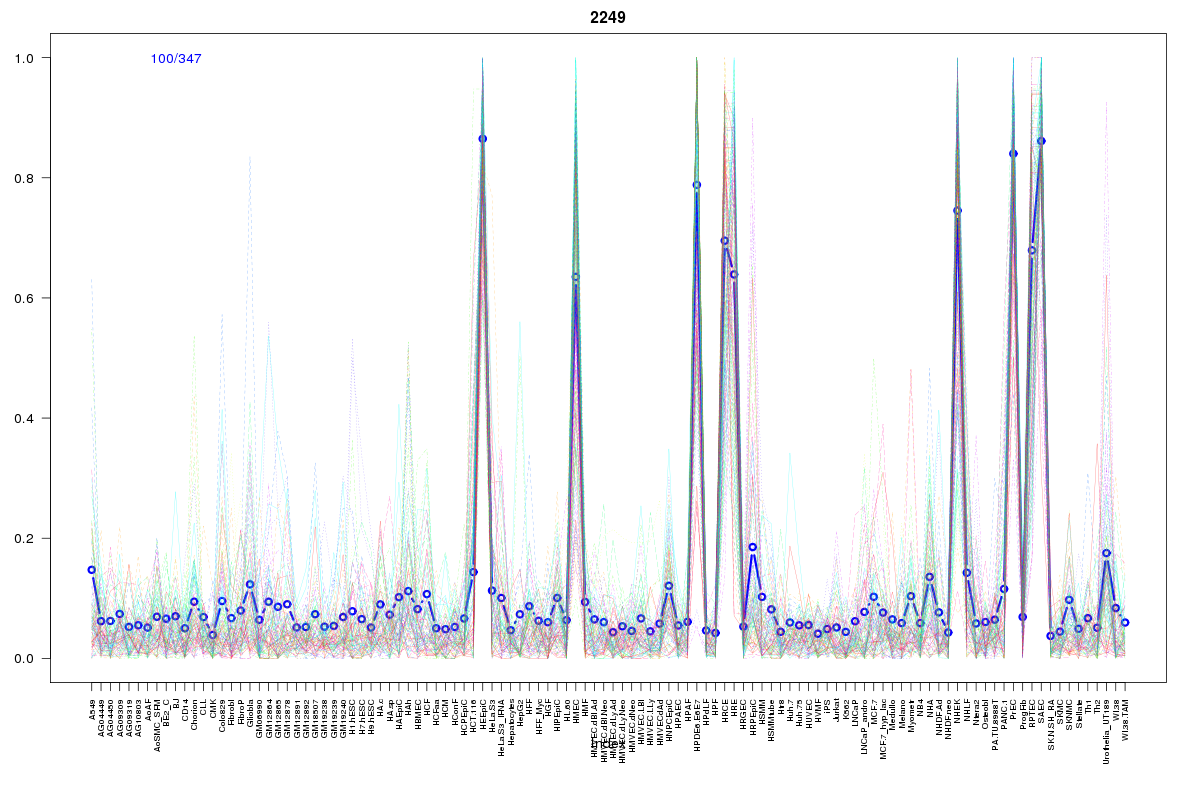
Cluster Hypersensitivity Profile

Genomic Location Trend
These plots show the distribution of the DHS sites surrounding the Transcript Start Site of the nearest gene.
Stats
Number of sites: 347Promoter: 3%
CpG-Island: 0%
Conserved: 35%
Enriched Motifs & Matches
Match Detail: [Jaspar]
|
| ||
|---|---|---|
| Sites: 46/100 | e-val: 0.00000000027 | ||
| Factor | e-val(match) | DB |
| AP1 | 0.0000000029615 | JASPAR |
| NFE2L2 | 0.000000004412 | JASPAR |
| NFE2L1::MafG | 0.00029655 | JASPAR |
| Pax2 | 0.0090653 | JASPAR |
| Lhx3 | 0.028506 | JASPAR |
BED file downloads
Top 10 Example Regions
| Location | Gene Link | Dist. |
|---|---|---|
| chr18: 61094800-61094950 | SERPINB5 | 38.45 |
| chr18: 61094800-61094950 | ATP5G1P6 | 38.45 |
| chr18: 61094800-61094950 | KDSR | 38.45 |
| chr18: 61094800-61094950 | VPS4B | 38.45 |
| chr12: 93516440-93516590 | RP11-511B23.3 | 41.18 |
| chr19: 50435540-50435690 | SIGLEC11 | 52.07 |
| chr2: 86645220-86645370 | CHMP3 | 58.65 |
| chr2: 86645220-86645370 | RNF103-CHMP3 | 58.65 |
| chr2: 86645220-86645370 | KDM3A | 58.65 |
| chr4: 157855000-157855150 | RP11-612J15.3 | 59.56 |