SOM cluster: 2232
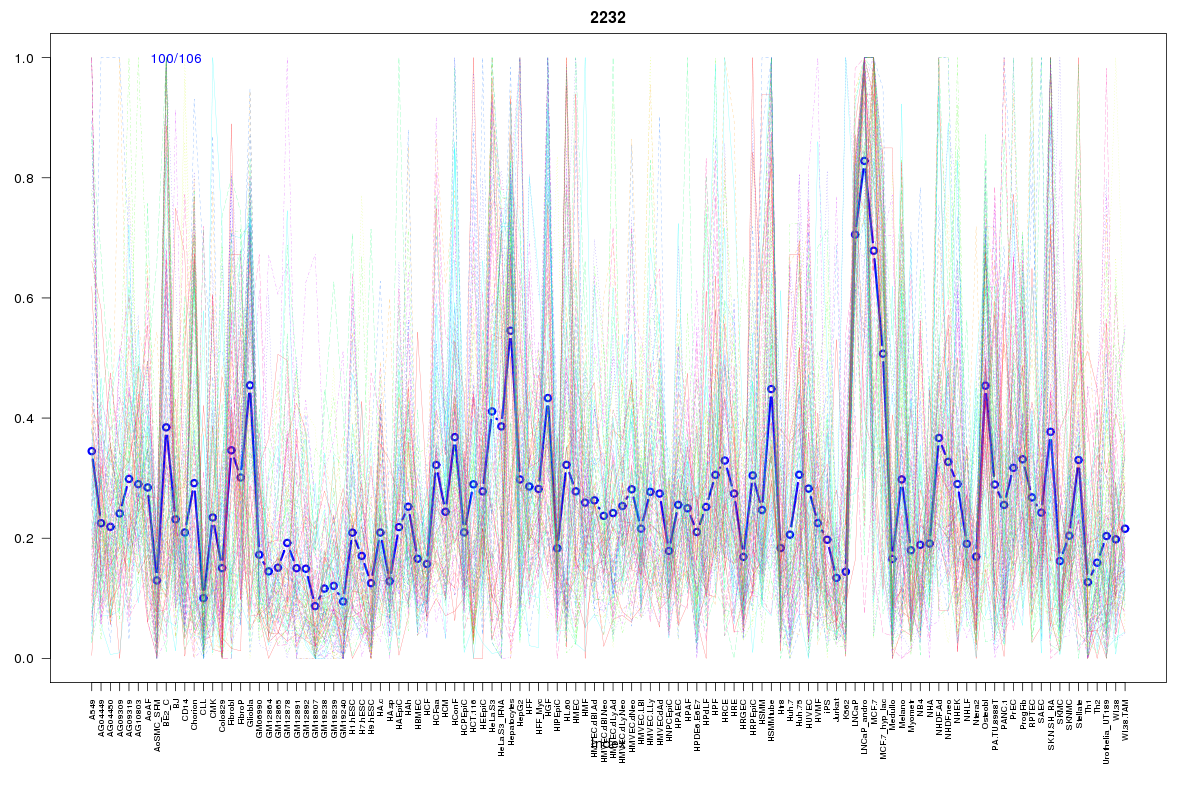
Cluster Hypersensitivity Profile

Genomic Location Trend
These plots show the distribution of the DHS sites surrounding the Transcript Start Site of the nearest gene.
Stats
Number of sites: 106Promoter: 11%
CpG-Island: 10%
Conserved: 49%
Enriched Motifs & Matches
Match Detail: [Jaspar]
|
| ||
|---|---|---|
| Sites: 71/100 | e-val: 6.2e-21 | ||
| Factor | e-val(match) | DB |
| Myf | 0.00041247 | JASPAR |
| SP1 | 0.00073399 | JASPAR |
| TP53 | 0.0067115 | JASPAR |
| Klf4 | 0.010798 | JASPAR |
| Zfx | 0.014805 | JASPAR |
|
| ||
| Sites: 47/100 | e-val: 0.000000000000041 | ||
| Factor | e-val(match) | DB |
| Tal1::Gata1 | 0.0034038 | JASPAR |
| SP1 | 0.0068677 | JASPAR |
| TP53 | 0.0074634 | JASPAR |
| Klf4 | 0.0095598 | JASPAR |
| Stat3 | 0.017197 | JASPAR |
|
| ||
| Sites: 43/100 | e-val: 0.0000037 | ||
| Factor | e-val(match) | DB |
| SP1 | 0.00016159 | JASPAR |
| SPI1 | 0.0003297 | JASPAR |
| Tal1::Gata1 | 0.0011663 | JASPAR |
| MZF1_5-13 | 0.011581 | JASPAR |
| RXR::RAR_DR5 | 0.014744 | JASPAR |
BED file downloads
Top 10 Example Regions
| Location | Gene Link | Dist. |
|---|---|---|
| chr17: 38228300-38228450 | THRA | 40.65 |
| chr17: 1363660-1363810 | CRK | 43.14 |
| chr17: 1363660-1363810 | PITPNA | 43.14 |
| chr17: 1363660-1363810 | YWHAE | 43.14 |
| chr17: 1363660-1363810 | INPP5K | 43.14 |
| chrX: 152992700-152992850 | SRPK3 | 51.7 |
| chr22: 39918900-39919050 | TAB1 | 53.73 |
| chr22: 39918900-39919050 | RP5-1104E15.6 | 53.73 |
| chr11: 17427260-17427410 | ABCC8 | 58.39 |
| chr3: 50276240-50276390 | HYAL1 | 64.69 |