SOM cluster: 2222
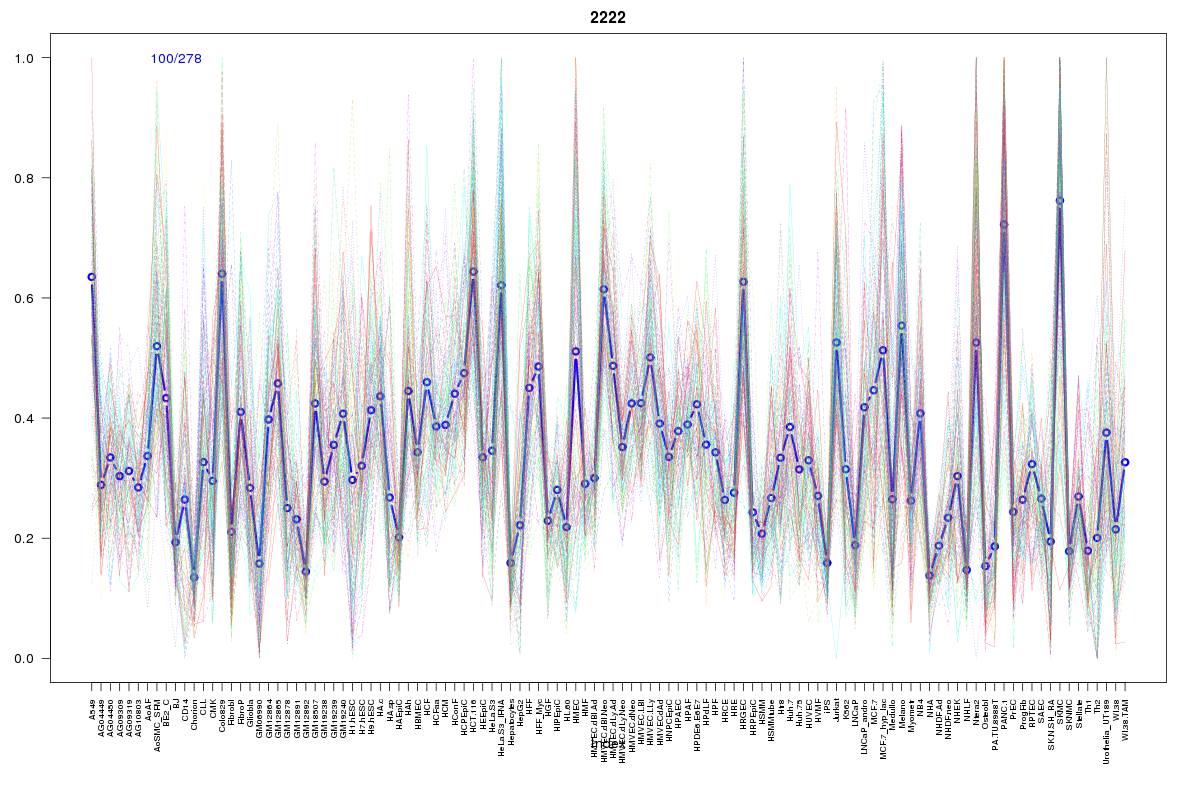
Cluster Hypersensitivity Profile

Genomic Location Trend
These plots show the distribution of the DHS sites surrounding the Transcript Start Site of the nearest gene.
Stats
Number of sites: 278Promoter: 4%
CpG-Island: 0%
Conserved: 87%
Enriched Motifs & Matches
Match Detail: [Jaspar]
|
| ||
|---|---|---|
| Sites: 94/100 | e-val: 0 | ||
| Factor | e-val(match) | DB |
| CTCF | 0.0000000000000038858 | JASPAR |
| INSM1 | 0.0023154 | JASPAR |
| Zfp423 | 0.0050769 | JASPAR |
| T | 0.016371 | JASPAR |
| PLAG1 | 0.022952 | JASPAR |
|
| ||
| Sites: 25/100 | e-val: 0.26 | ||
| Factor | e-val(match) | DB |
| Foxd3 | 0.000020906 | JASPAR |
| MEF2A | 0.000040224 | JASPAR |
| Foxq1 | 0.00011691 | JASPAR |
| FOXI1 | 0.00023325 | JASPAR |
| HNF1B | 0.00047401 | JASPAR |
BED file downloads
Top 10 Example Regions
| Location | Gene Link | Dist. |
|---|---|---|
| chr7: 142273740-142273890 | TRBV12-2 | 44.01 |
| chr7: 142273740-142273890 | TRBV11-2 | 44.01 |
| chr8: 90730580-90730730 | RP11-37B2.1 | 53.19 |
| chr6: 39948940-39949090 | RP11-61I13.3 | 61.52 |
| chr3: 139656625-139656775 | CLSTN2 | 65.15 |
| chr13: 97681080-97681230 | OXGR1 | 66.3 |
| chr7: 110730000-110730150 | snoU13 | 66.35 |
| chr7: 33225440-33225590 | RP9 | 67.19 |
| chr8: 75002800-75002950 | RP11-6I2.4 | 67.79 |
| chr8: 75002800-75002950 | RP11-6I2.3 | 67.79 |