SOM cluster: 2197
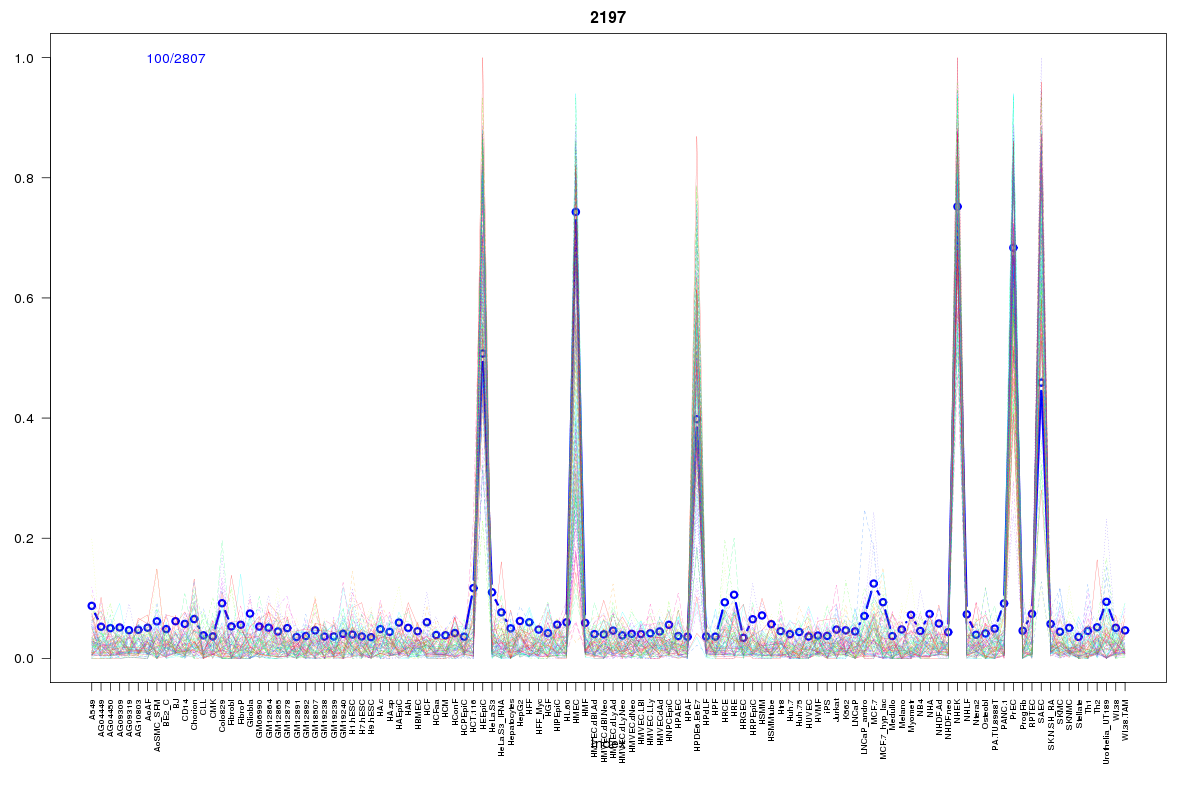
Cluster Hypersensitivity Profile

Genomic Location Trend
These plots show the distribution of the DHS sites surrounding the Transcript Start Site of the nearest gene.
Stats
Number of sites: 2807Promoter: 5%
CpG-Island: 0%
Conserved: 26%
Enriched Motifs & Matches
Match Detail: [Jaspar]
|
| ||
|---|---|---|
| Sites: 41/100 | e-val: 2.2e-19 | ||
| Factor | e-val(match) | DB |
| TP53 | 0.00000000071325 | JASPAR |
| SRF | 0.00038131 | JASPAR |
| Tcfcp2l1 | 0.00077936 | JASPAR |
| znf143 | 0.013222 | JASPAR |
| INSM1 | 0.013683 | JASPAR |
BED file downloads
Top 10 Example Regions
| Location | Gene Link | Dist. |
|---|---|---|
| chr1: 147229840-147229990 | GJA5 | 13.02 |
| chr1: 147229840-147229990 | RP11-433J22.2 | 13.02 |
| chr3: 31953280-31953430 | OSBPL10 | 33.12 |
| chr19: 38787400-38787550 | C19orf33 | 33.67 |
| chr19: 38787400-38787550 | KCNK6 | 33.67 |
| chr19: 38787400-38787550 | SPINT2 | 33.67 |
| chr1: 208381560-208381710 | PLXNA2 | 34.77 |
| chr8: 120126860-120127010 | MAL2 | 37.32 |
| chr1: 60299780-60299930 | CYP2J2 | 39.63 |
| chr1: 160368820-160368970 | VANGL2 | 42.19 |