SOM cluster: 2194
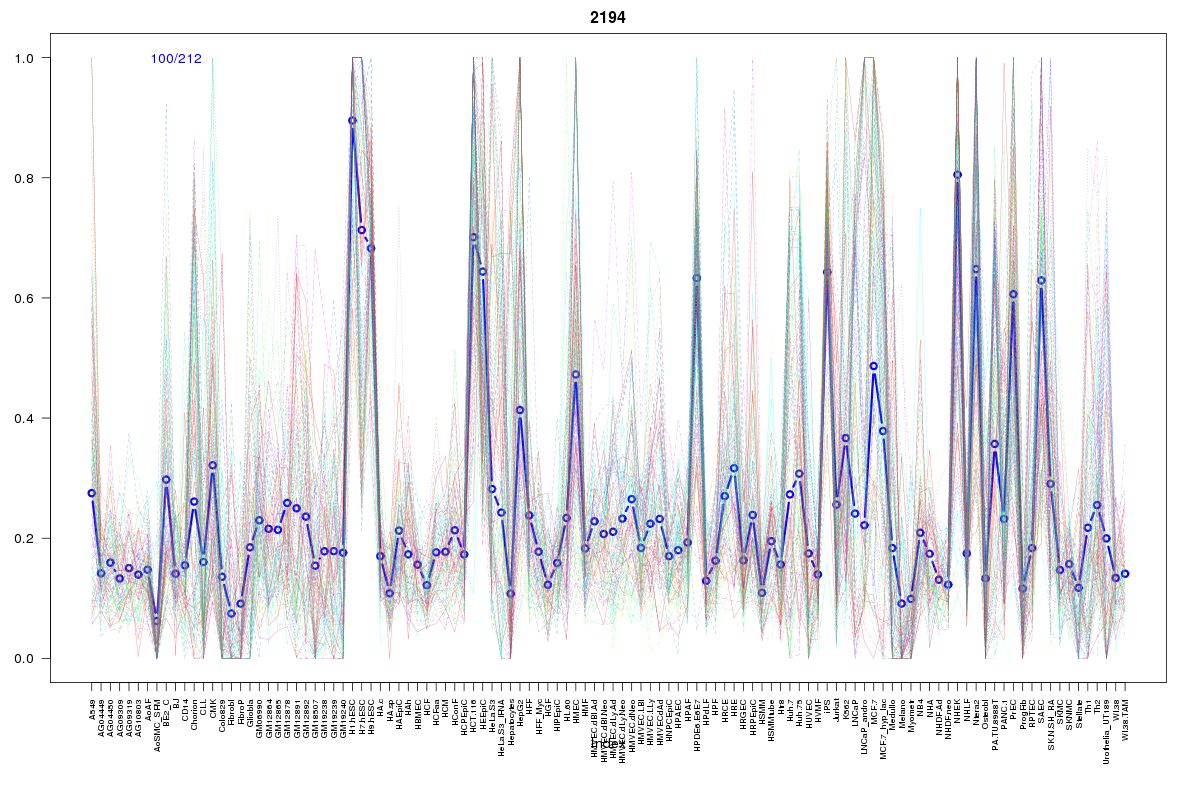
Cluster Hypersensitivity Profile

Genomic Location Trend
These plots show the distribution of the DHS sites surrounding the Transcript Start Site of the nearest gene.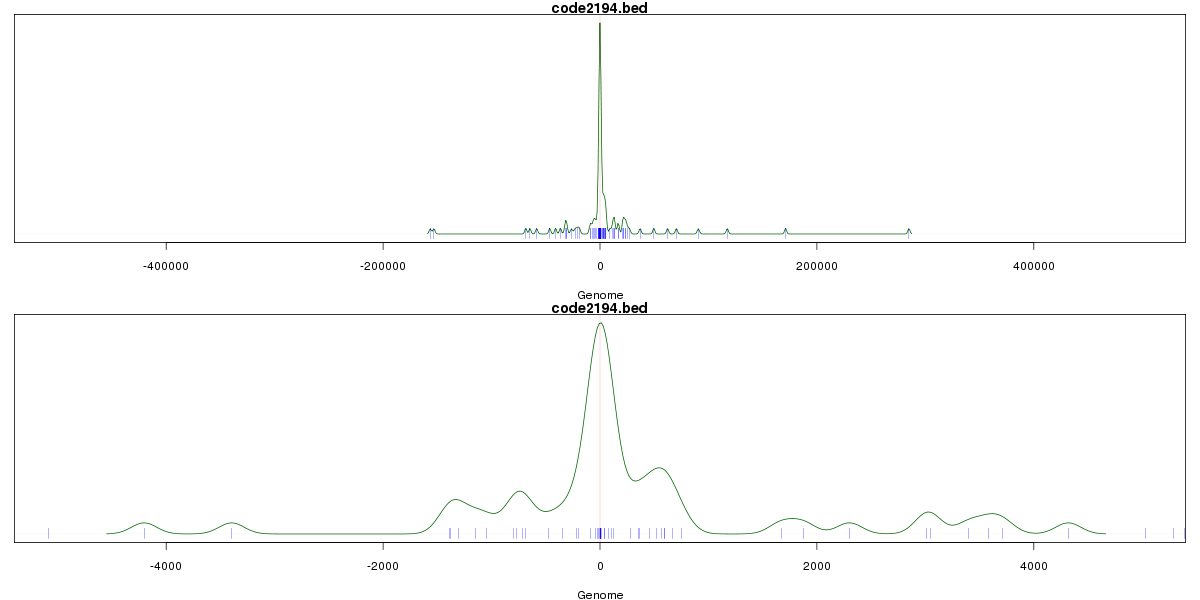
Stats
Number of sites: 212Promoter: 27%
CpG-Island: 26%
Conserved: 61%
Enriched Motifs & Matches
Match Detail: [Jaspar]
|
| ||
|---|---|---|
| Sites: 85/100 | e-val: 0 | ||
| Factor | e-val(match) | DB |
| SP1 | 0.00001365 | JASPAR |
| RREB1 | 0.000077643 | JASPAR |
| TP53 | 0.0001359 | JASPAR |
| Klf4 | 0.00090776 | JASPAR |
| PLAG1 | 0.0010659 | JASPAR |
|
| ||
| Sites: 92/100 | e-val: 1.4e-24 | ||
| Factor | e-val(match) | DB |
| SP1 | 0.00000000023598 | JASPAR |
| Klf4 | 0.00000000048114 | JASPAR |
| Egr1 | 0.0034951 | JASPAR |
| MZF1_5-13 | 0.0070513 | JASPAR |
| MZF1_1-4 | 0.012699 | JASPAR |
|
| ||
| Sites: 49/100 | e-val: 0.000067 | ||
| Factor | e-val(match) | DB |
| ZEB1 | 0.00001443 | JASPAR |
| MYC::MAX | 0.000039861 | JASPAR |
| T | 0.000082699 | JASPAR |
| CTCF | 0.00013341 | JASPAR |
| Myc | 0.00014172 | JASPAR |
BED file downloads
Top 10 Example Regions
| Location | Gene Link | Dist. |
|---|---|---|
| chr19: 13275640-13275790 | NFIX | 49.32 |
| chr19: 13275640-13275790 | NACC1 | 49.32 |
| chr9: 130689765-130689915 | ENG | 54.2 |
| chr9: 130689765-130689915 | PIP5KL1 | 54.2 |
| chr3: 127413340-127413490 | MGLL | 56.34 |
| chr3: 127413340-127413490 | PODXL2 | 56.34 |
| chr2: 10197860-10198010 | SNORA2 | 59.16 |
| chr7: 73157300-73157450 | ABHD11 | 62.08 |
| chr7: 73157300-73157450 | CLDN3 | 62.08 |
| chr7: 73157300-73157450 | CLDN4 | 62.08 |