SOM cluster: 2170
Cluster Hypersensitivity Profile

Genomic Location Trend
These plots show the distribution of the DHS sites surrounding the Transcript Start Site of the nearest gene.
Stats
Number of sites: 730Promoter: 5%
CpG-Island: 0%
Conserved: 50%
Enriched Motifs & Matches
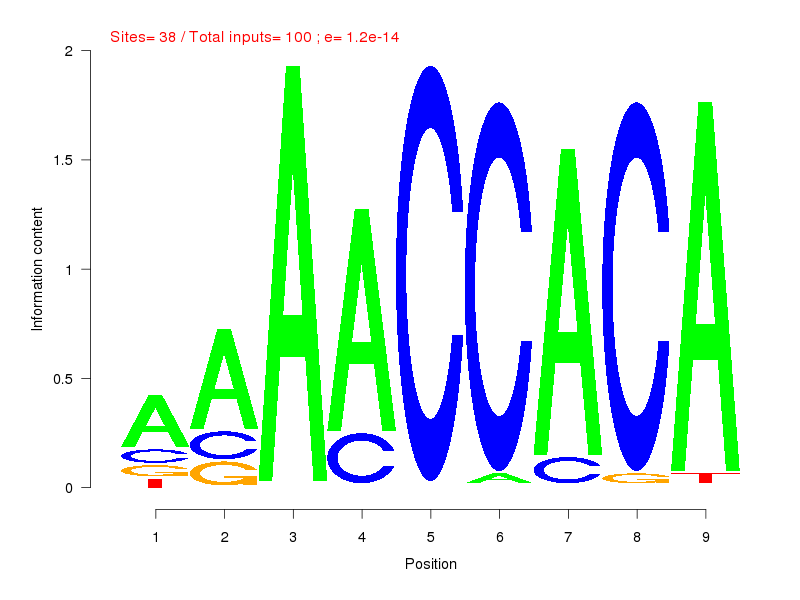
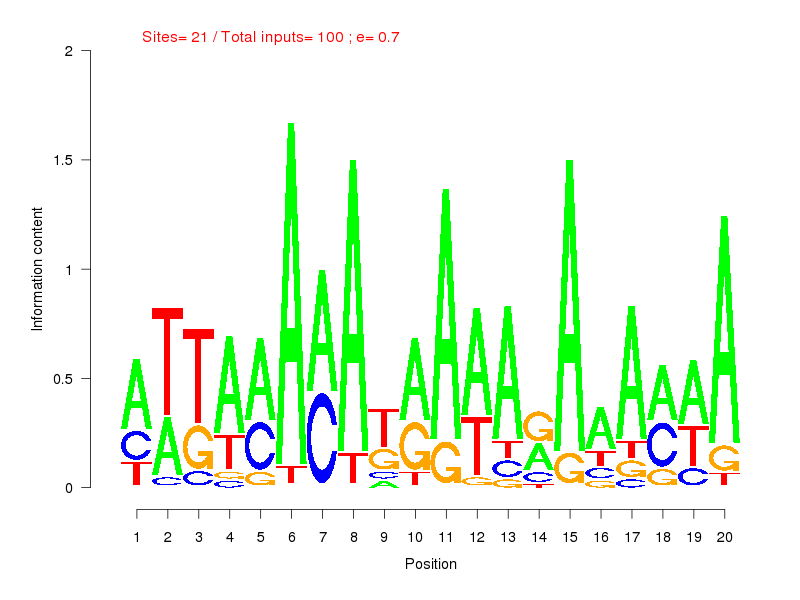
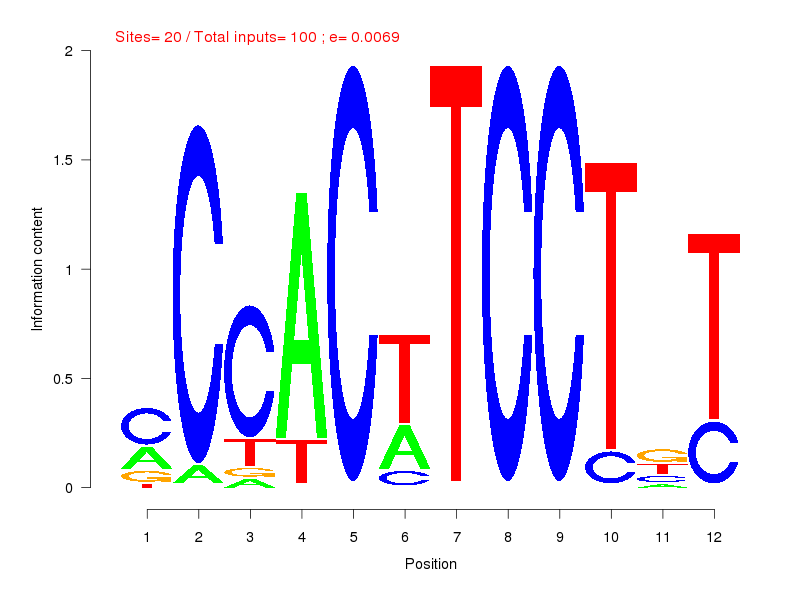
Match Detail: [Jaspar]

| ||
|---|---|---|
| Sites: 38/100 | e-val: 0.000000000000012 | ||
| Factor | e-val(match) | DB |
| RUNX1 | 0.00000058061 | JASPAR |
| RREB1 | 0.00022353 | JASPAR |
| Foxd3 | 0.001487 | JASPAR |
| ZNF354C | 0.0019429 | JASPAR |
| En1 | 0.0043127 | JASPAR |

| ||
| Sites: 21/100 | e-val: 0.7 | ||
| Factor | e-val(match) | DB |
| ARID3A | 0.00029845 | JASPAR |
| HNF1B | 0.00039413 | JASPAR |
| MEF2A | 0.0055004 | JASPAR |
| Foxq1 | 0.0069552 | JASPAR |
| Foxd3 | 0.011599 | JASPAR |

| ||
| Sites: 20/100 | e-val: 0.0069 | ||
| Factor | e-val(match) | DB |
| SPI1 | 0.0000000069969 | JASPAR |
| FEV | 0.000000010633 | JASPAR |
| ELK4 | 0.00000021831 | JASPAR |
| GABPA | 0.0000045716 | JASPAR |
| ELF5 | 0.000010449 | JASPAR |
BED file downloads
Top 10 Example Regions
| Location | Gene Link | Dist. |
|---|---|---|
| chr1: 92014100-92014250 | CDC7 | 4.17 |
| chr2: 112913180-112913330 | ZC3H8 | 44.72 |
| chr12: 12594900-12595050 | MANSC1 | 44.89 |
| chr12: 12594900-12595050 | LOH12CR1 | 44.89 |
| chr1: 117296940-117297090 | CD2 | 45.77 |
| chr10: 120971700-120971850 | FAM45A | 45.79 |
| chr10: 120971700-120971850 | GRK5 | 45.79 |
| chr10: 120971700-120971850 | RN7SL749P | 45.79 |
| chr17: 55677580-55677730 | MSI2 | 46.89 |
| chr17: 76813280-76813430 | CYTH1 | 48.72 |