SOM cluster: 214
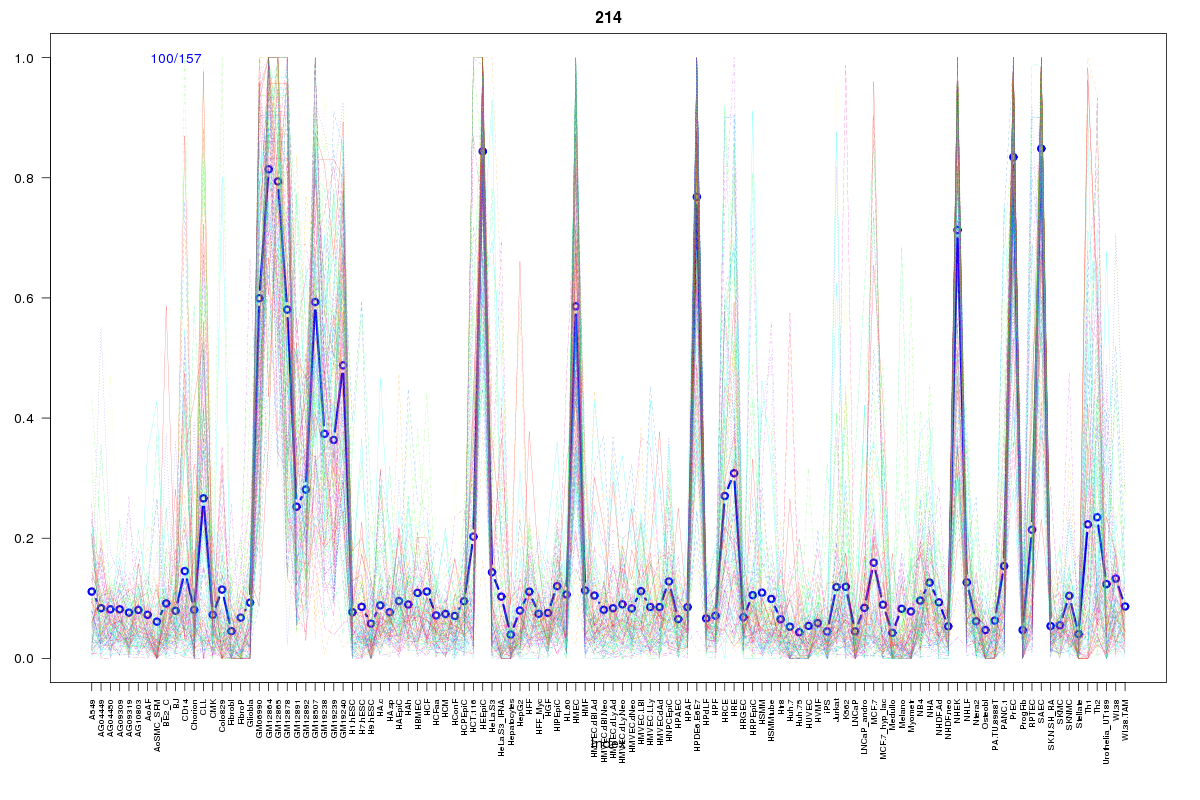
Cluster Hypersensitivity Profile

Genomic Location Trend
These plots show the distribution of the DHS sites surrounding the Transcript Start Site of the nearest gene.
Stats
Number of sites: 157Promoter: 4%
CpG-Island: 0%
Conserved: 33%
Enriched Motifs & Matches
Match Detail: [Jaspar]
|
| ||
|---|---|---|
| Sites: 37/100 | e-val: 0.000023 | ||
| Factor | e-val(match) | DB |
| AP1 | 0.000000000069052 | JASPAR |
| NFE2L2 | 0.000000005196 | JASPAR |
| PPARG | 0.0038792 | JASPAR |
| NFE2L1::MafG | 0.0043948 | JASPAR |
| Foxa2 | 0.01417 | JASPAR |
BED file downloads
Top 10 Example Regions
| Location | Gene Link | Dist. |
|---|---|---|
| chr18: 29070500-29070650 | DSG2 | 55.66 |
| chr18: 29070500-29070650 | DSG3 | 55.66 |
| chr2: 143625940-143626090 | KYNU | 61.81 |
| chr17: 76155960-76156110 | TNRC6C | 65.79 |
| chr17: 76155960-76156110 | AC021593.1 | 65.79 |
| chr5: 172277240-172277390 | RP11-779O18.3 | 67.99 |
| chr15: 90734340-90734490 | SEMA4B | 70.15 |
| chr7: 30278840-30278990 | ZNRF2 | 70.88 |
| chr6: 252020-252170 | DUSP22 | 71.98 |
| chr11: 95220780-95220930 | RP11-338H14.1 | 72.49 |