SOM cluster: 2139
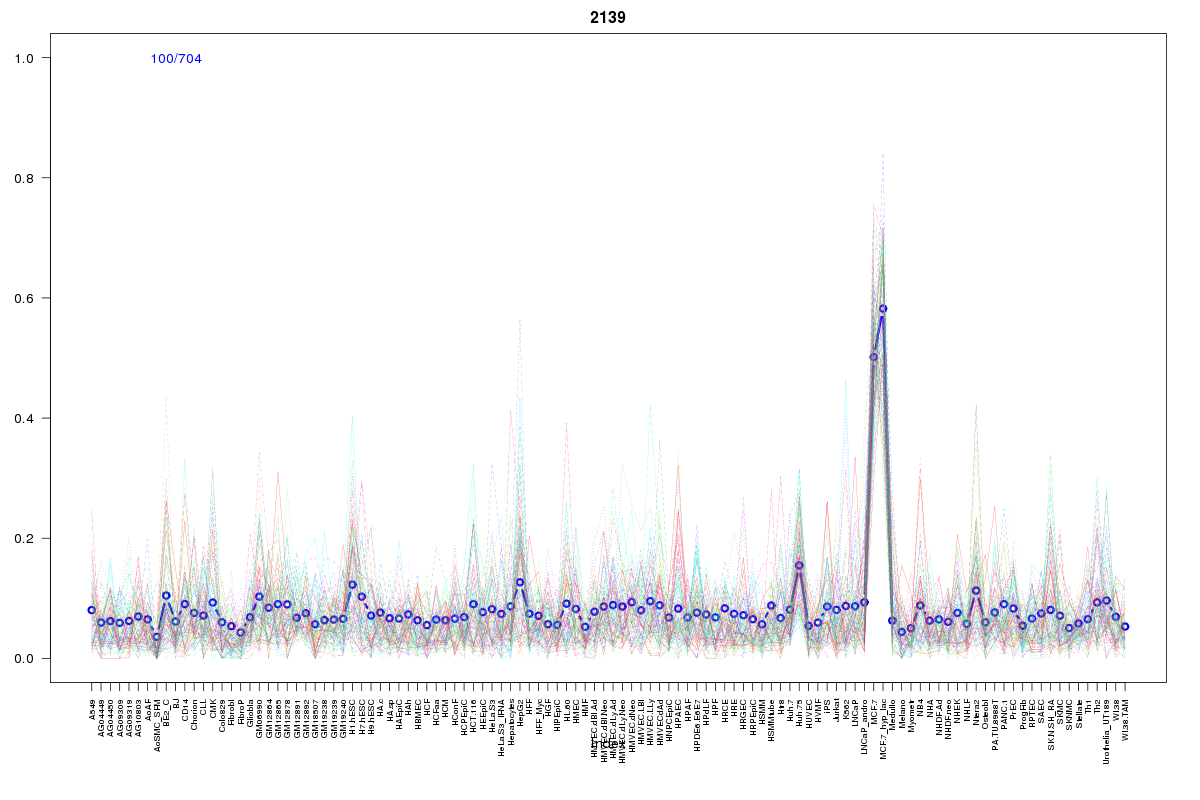
Cluster Hypersensitivity Profile

Genomic Location Trend
These plots show the distribution of the DHS sites surrounding the Transcript Start Site of the nearest gene.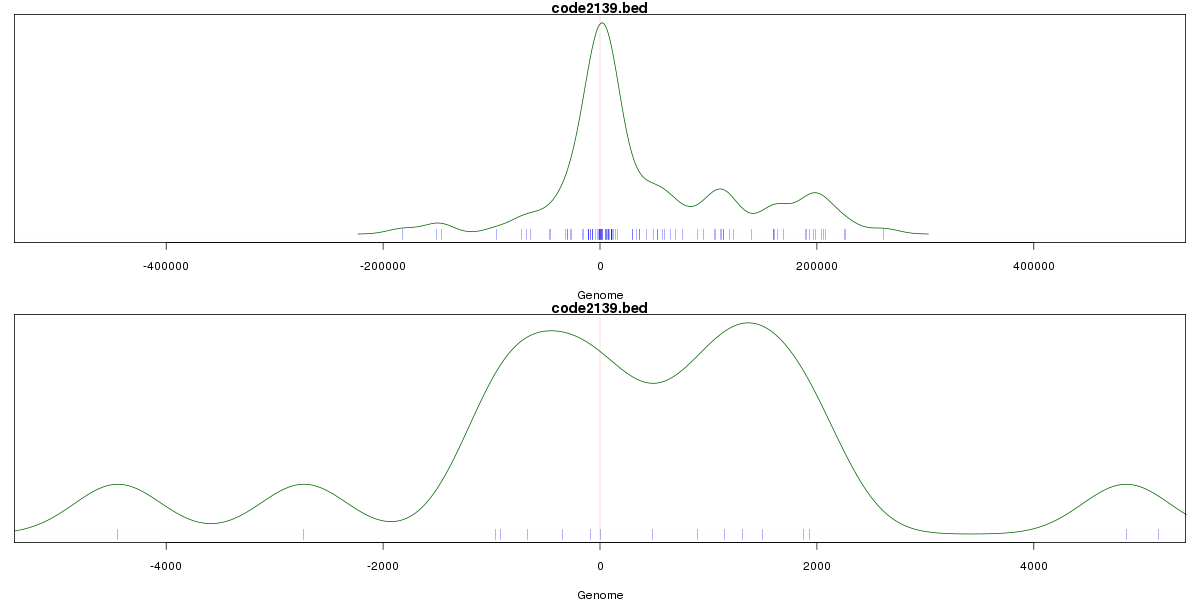
Stats
Number of sites: 704Promoter: 6%
CpG-Island: 5%
Conserved: 23%
Enriched Motifs & Matches
Match Detail: [Jaspar]
|
| ||
|---|---|---|
| Sites: 22/100 | e-val: 0.0000022 | ||
| Factor | e-val(match) | DB |
| EWSR1-FLI1 | 0.000054718 | JASPAR |
| SP1 | 0.00032447 | JASPAR |
| MZF1_5-13 | 0.00046451 | JASPAR |
| PLAG1 | 0.0025365 | JASPAR |
| znf143 | 0.003395 | JASPAR |
BED file downloads
Top 10 Example Regions
| Location | Gene Link | Dist. |
|---|---|---|
| chr15: 96880480-96880630 | NR2F2 | 35.24 |
| chr17: 59480145-59480295 | C17orf82 | 42.23 |
| chr8: 104022900-104023050 | KB-1639H6.2 | 44.79 |
| chr8: 128805260-128805410 | PVT1 | 46.32 |
| chr3: 64007720-64007870 | PSMD6 | 52.91 |
| chr16: 2093465-2093615 | MIR1225 | 53.67 |
| chr1: 115052720-115052870 | RP4-591B8.2 | 53.81 |
| chr20: 49307180-49307330 | FAM65C | 55.89 |
| chr5: 176250385-176250535 | HK3 | 57.69 |
| chr17: 73483065-73483215 | TSEN54 | 58.12 |