SOM cluster: 2131
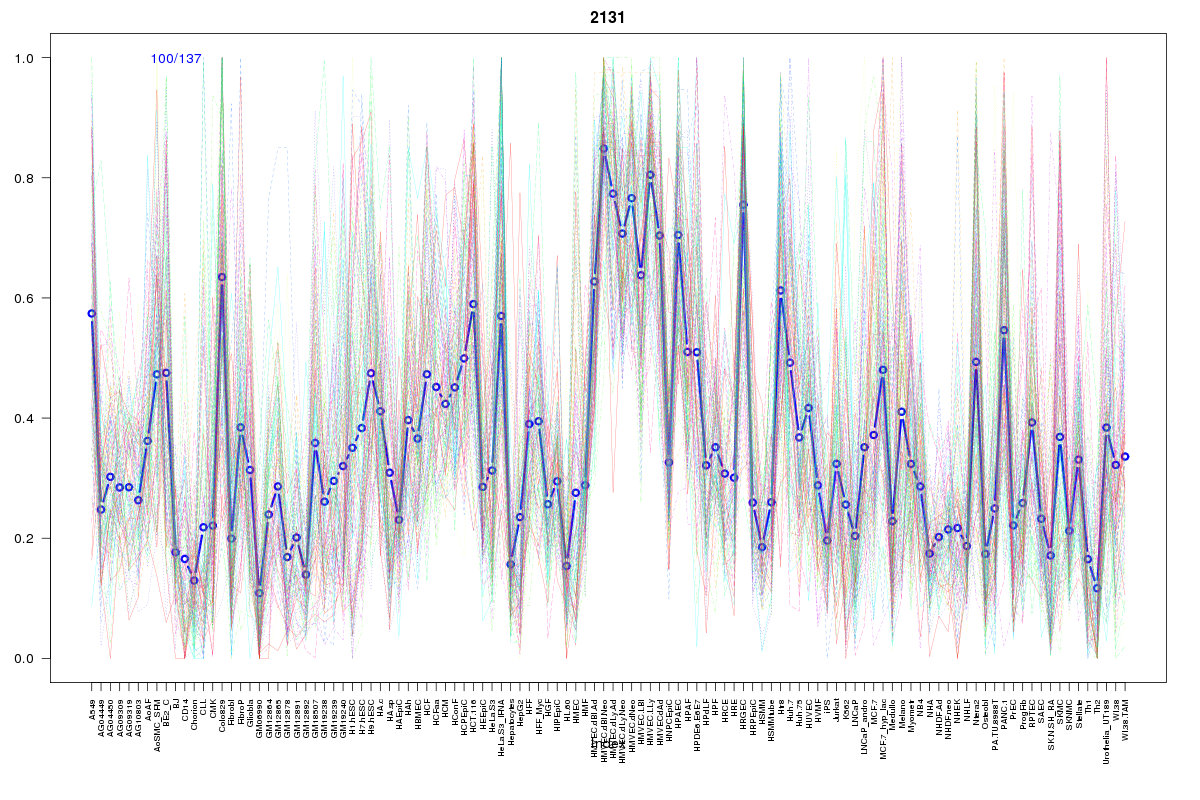
Cluster Hypersensitivity Profile

Genomic Location Trend
These plots show the distribution of the DHS sites surrounding the Transcript Start Site of the nearest gene.
Stats
Number of sites: 137Promoter: 3%
CpG-Island: 0%
Conserved: 69%
Enriched Motifs & Matches
Match Detail: [Jaspar]
|
| ||
|---|---|---|
| Sites: 73/100 | e-val: 0 | ||
| Factor | e-val(match) | DB |
| CTCF | 0.000000000000004774 | JASPAR |
| INSM1 | 0.00024144 | JASPAR |
| Zfp423 | 0.00027385 | JASPAR |
| T | 0.002603 | JASPAR |
| PLAG1 | 0.007631 | JASPAR |
BED file downloads
Top 10 Example Regions
| Location | Gene Link | Dist. |
|---|---|---|
| chrX: 130964980-130965130 | RP11-512H23.2 | 34.81 |
| chr15: 101212320-101212470 | Y_RNA | 38.86 |
| chr12: 13128720-13128870 | KIAA1467 | 38.99 |
| chr12: 13128720-13128870 | HEBP1 | 38.99 |
| chr9: 116352280-116352430 | RP11-168K11.2 | 43.24 |
| chr9: 116352280-116352430 | RGS3 | 43.24 |
| chr12: 10365160-10365310 | GABARAPL1 | 47.07 |
| chr8: 89302080-89302230 | MMP16 | 50.46 |
| chr12: 79257640-79257790 | SYT1 | 57.75 |
| chr11: 74032640-74032790 | P4HA3 | 58.07 |