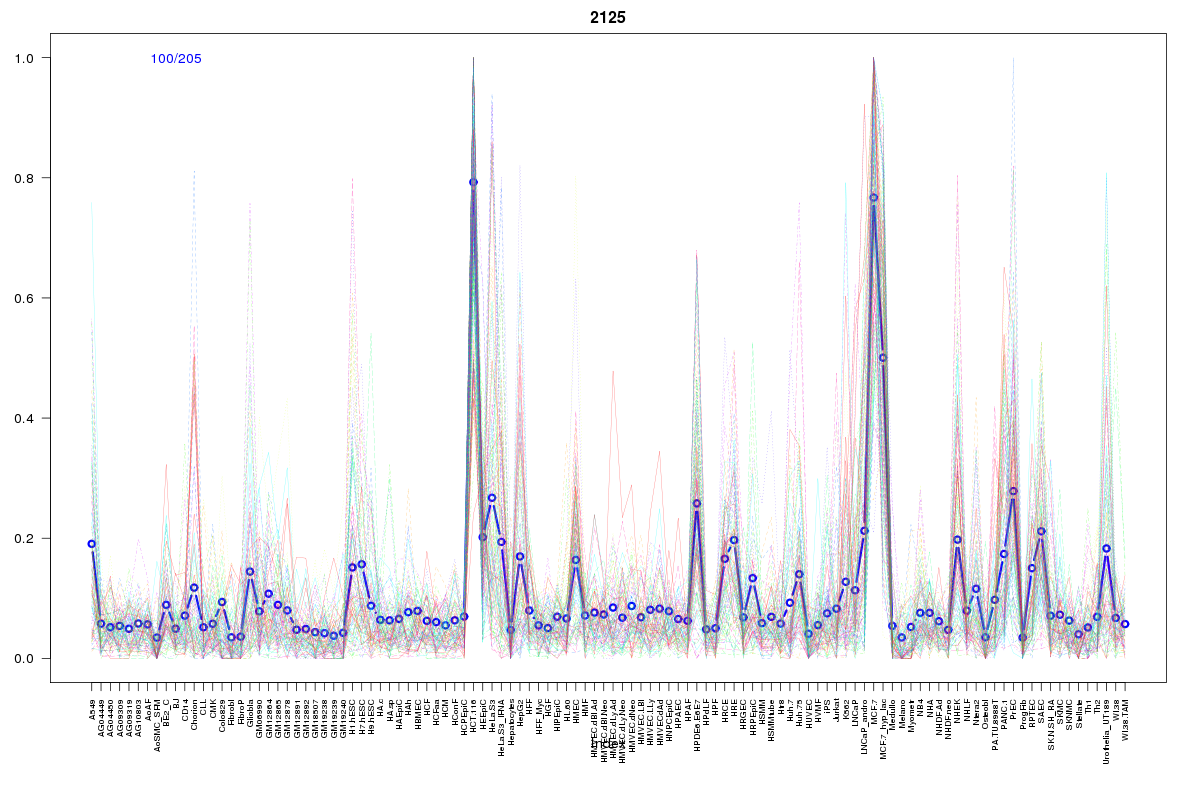
SOM cluster: 2125
Cluster Hypersensitivity Profile

Genomic Location Trend
These plots show the distribution of the DHS sites surrounding the Transcript Start Site of the nearest gene.
Stats
Number of sites: 205Promoter: 9%
CpG-Island: 1%
Conserved: 32%
Enriched Motifs & Matches
Match Detail: [Jaspar]
|
| ||
|---|---|---|
| Sites: 16/100 | e-val: 0.14 | ||
| Factor | e-val(match) | DB |
| AP1 | 0.00000000096699 | JASPAR |
| NFE2L2 | 0.0000000013708 | JASPAR |
| PPARG | 0.0009134 | JASPAR |
| Pax2 | 0.0033763 | JASPAR |
| NR4A2 | 0.0050929 | JASPAR |
BED file downloads
Top 10 Example Regions
| Location | Gene Link | Dist. |
|---|---|---|
| chr10: 102870985-102871135 | TLX1NB | 28.38 |
| chr12: 116930500-116930650 | LINC00173 | 43.33 |
| chr1: 204493080-204493230 | RP11-430C7.2 | 47.62 |
| chr19: 13280905-13281055 | IER2 | 50.01 |
| chr17: 73597645-73597795 | TSEN54 | 53.97 |
| chr17: 73597645-73597795 | SMIM5 | 53.97 |
| chr17: 73597645-73597795 | LLGL2 | 53.97 |
| chr17: 73597645-73597795 | SAP30BP | 53.97 |
| chr17: 74023285-74023435 | SRP68 | 59.13 |
| chr17: 74023285-74023435 | FBF1 | 59.13 |