SOM cluster: 2115
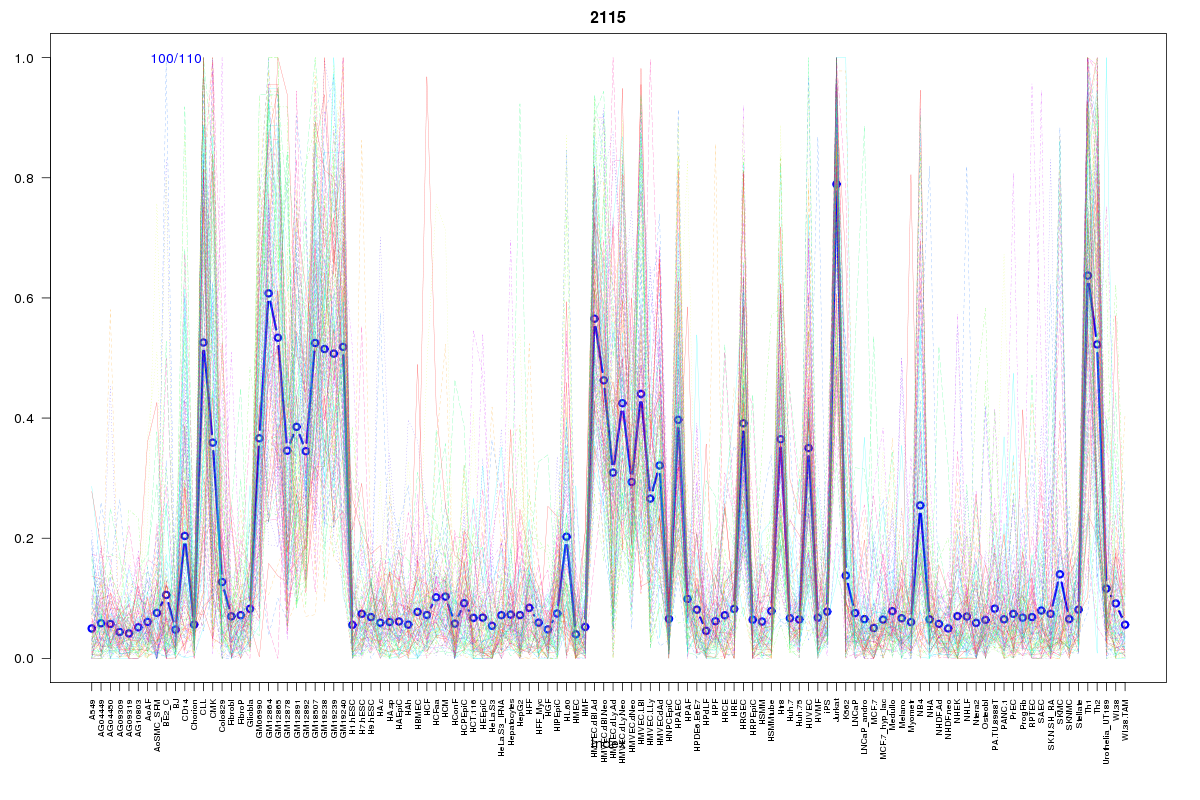
Cluster Hypersensitivity Profile

Genomic Location Trend
These plots show the distribution of the DHS sites surrounding the Transcript Start Site of the nearest gene.
Stats
Number of sites: 110Promoter: 10%
CpG-Island: 0%
Conserved: 55%
Enriched Motifs & Matches
Match Detail: [Jaspar]
|
| ||
|---|---|---|
| Sites: 70/100 | e-val: 4.2e-40 | ||
| Factor | e-val(match) | DB |
| FEV | 0.000000000015505 | JASPAR |
| ELK4 | 0.0000000074724 | JASPAR |
| SPI1 | 0.000000085539 | JASPAR |
| Stat3 | 0.00000062957 | JASPAR |
| ELF5 | 0.0000011068 | JASPAR |
|
| ||
| Sites: 17/100 | e-val: 0.000000025 | ||
| Factor | e-val(match) | DB |
| NFATC2 | 0.0023518 | JASPAR |
| NR1H2::RXRA | 0.0053048 | JASPAR |
| IRF1 | 0.018151 | JASPAR |
| Foxq1 | 0.019496 | JASPAR |
| Evi1 | 0.020709 | JASPAR |
BED file downloads
Top 10 Example Regions
| Location | Gene Link | Dist. |
|---|---|---|
| chr12: 112568460-112568610 | TRAFD1 | 42.51 |
| chr1: 172350000-172350150 | PIGC | 60.81 |
| chr1: 203290000-203290150 | BTG2 | 61.36 |
| chr2: 204975100-204975250 | AC009965.1 | 64.04 |
| chr14: 23030780-23030930 | TRAJ32 | 69.31 |
| chr14: 23030780-23030930 | TRAJ42 | 69.31 |
| chr14: 23030780-23030930 | ABHD4 | 69.31 |
| chr14: 23030780-23030930 | TRAJ5 | 69.31 |
| chr14: 23030780-23030930 | TRAJ17 | 69.31 |
| chr14: 23030780-23030930 | TRAJ26 | 69.31 |