SOM cluster: 2108
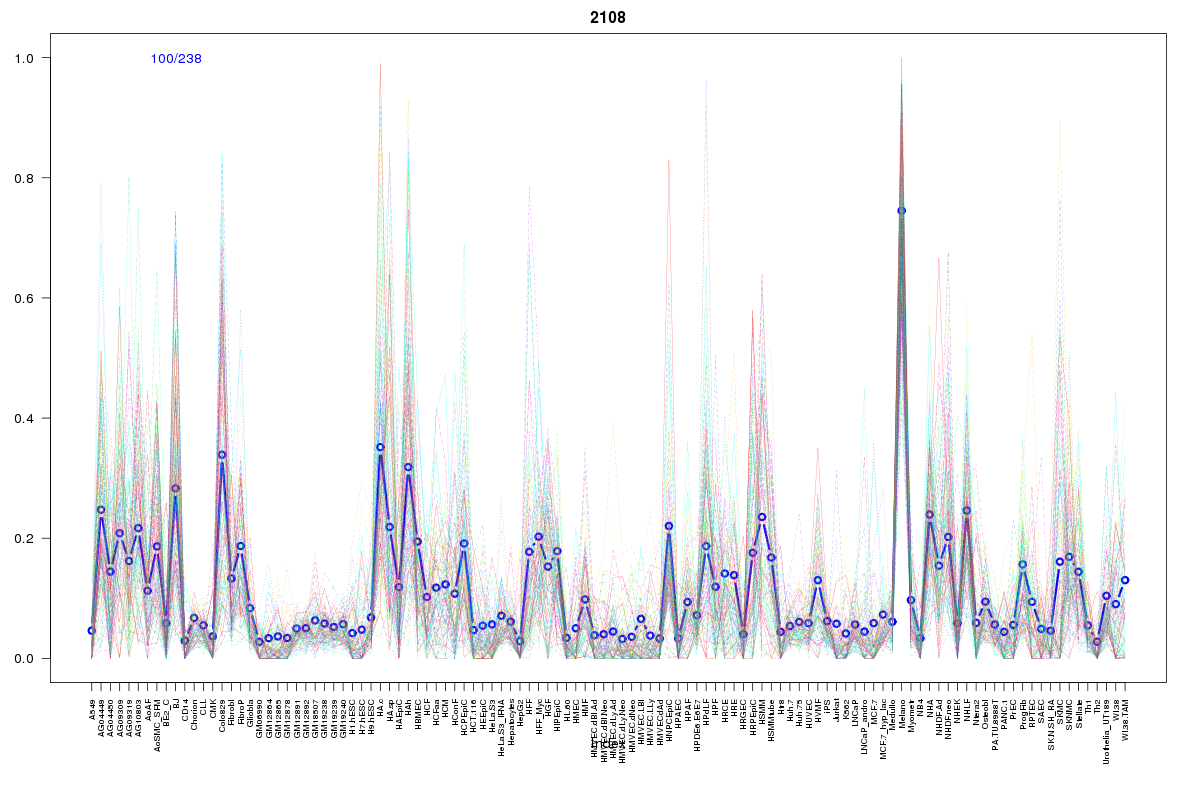
Cluster Hypersensitivity Profile

Genomic Location Trend
These plots show the distribution of the DHS sites surrounding the Transcript Start Site of the nearest gene.
Stats
Number of sites: 238Promoter: 2%
CpG-Island: 0%
Conserved: 59%
Enriched Motifs & Matches
Match Detail: [Jaspar]
|
| ||
|---|---|---|
| Sites: 32/100 | e-val: 0.0000022 | ||
| Factor | e-val(match) | DB |
| NFATC2 | 0.00017813 | JASPAR |
| IRF1 | 0.00091155 | JASPAR |
| FOXA1 | 0.0019271 | JASPAR |
| Foxa2 | 0.0022954 | JASPAR |
| IRF2 | 0.0058413 | JASPAR |
|
| ||
| Sites: 25/100 | e-val: 0.000002 | ||
| Factor | e-val(match) | DB |
| RUNX1 | 0.0000012005 | JASPAR |
| RREB1 | 0.00091147 | JASPAR |
| HNF1A | 0.0040796 | JASPAR |
| Pax4 | 0.0050363 | JASPAR |
| Pou5f1 | 0.0063651 | JASPAR |
BED file downloads
Top 10 Example Regions
| Location | Gene Link | Dist. |
|---|---|---|
| chr6: 8180465-8180615 | EEF1E1 | 58.63 |
| chr8: 128957785-128957935 | RNU4-25P | 59.43 |
| chr22: 46460880-46461030 | FLJ27365 | 59.47 |
| chrX: 107365960-107366110 | VSIG1 | 59.72 |
| chr4: 150927440-150927590 | DCLK2 | 63.74 |
| chr4: 120518660-120518810 | PDE5A | 68.56 |
| chr4: 120518660-120518810 | RP11-33B1.1 | 68.56 |
| chr3: 138069020-138069170 | MRAS | 70.38 |
| chr9: 111735040-111735190 | IKBKAP | 70.68 |
| chr11: 12505900-12506050 | PARVA | 72.18 |