SOM cluster: 2093
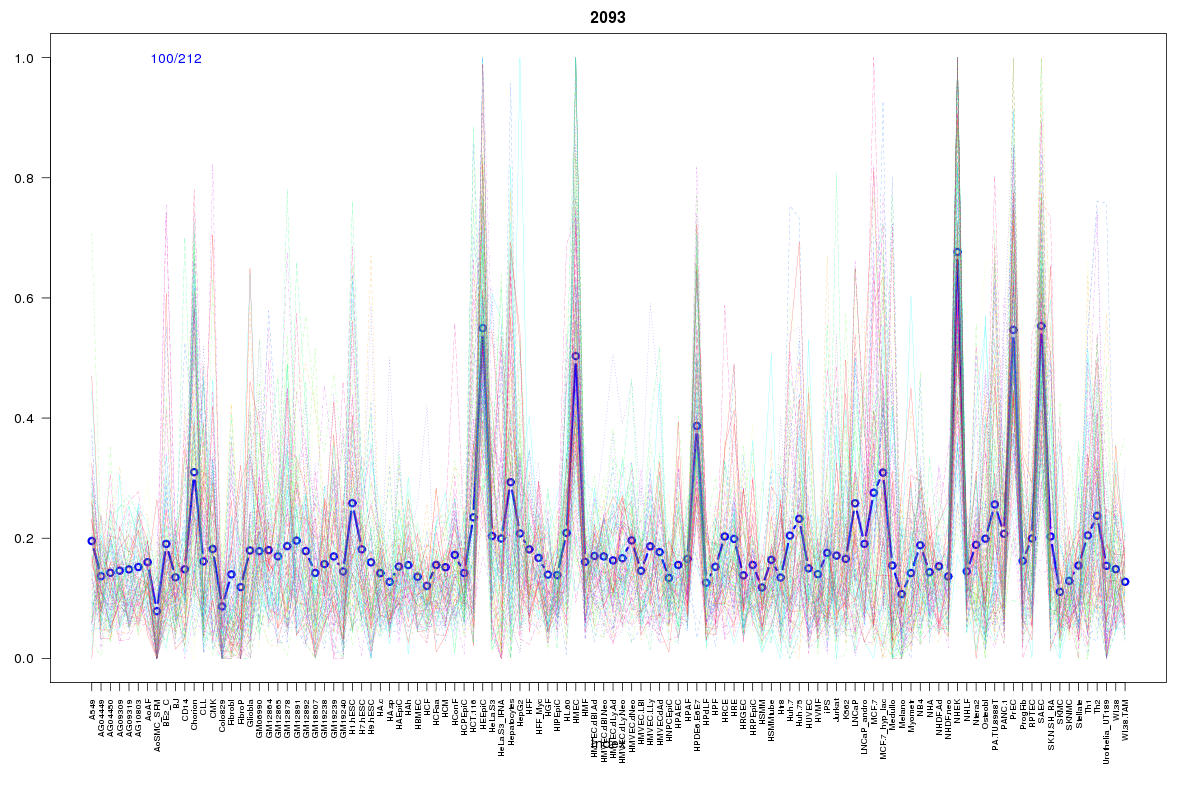
Cluster Hypersensitivity Profile

Genomic Location Trend
These plots show the distribution of the DHS sites surrounding the Transcript Start Site of the nearest gene.
Stats
Number of sites: 212Promoter: 23%
CpG-Island: 20%
Conserved: 44%
Enriched Motifs & Matches
Match Detail: [Jaspar]
|
| ||
|---|---|---|
| Sites: 60/100 | e-val: 0.000000015 | ||
| Factor | e-val(match) | DB |
| PLAG1 | 0.00015378 | JASPAR |
| SP1 | 0.0024019 | JASPAR |
| Zfx | 0.0067857 | JASPAR |
| TFAP2A | 0.014515 | JASPAR |
| NHLH1 | 0.015968 | JASPAR |
BED file downloads
Top 10 Example Regions
| Location | Gene Link | Dist. |
|---|---|---|
| chr8: 21987225-21987375 | PHYHIP | 53.41 |
| chr6: 30068620-30068770 | TRIM15 | 57.05 |
| chr6: 30068620-30068770 | RNF39 | 57.05 |
| chr17: 40705480-40705630 | HSD17B1 | 57.1 |
| chr19: 751140-751290 | FSTL3 | 58 |
| chr19: 751140-751290 | MISP | 58 |
| chr16: 66982265-66982415 | CA7 | 58.88 |
| chr16: 66982265-66982415 | CES2 | 58.88 |
| chr19: 10621320-10621470 | AP1M2 | 61.02 |
| chr19: 10621320-10621470 | S1PR5 | 61.02 |