SOM cluster: 2082
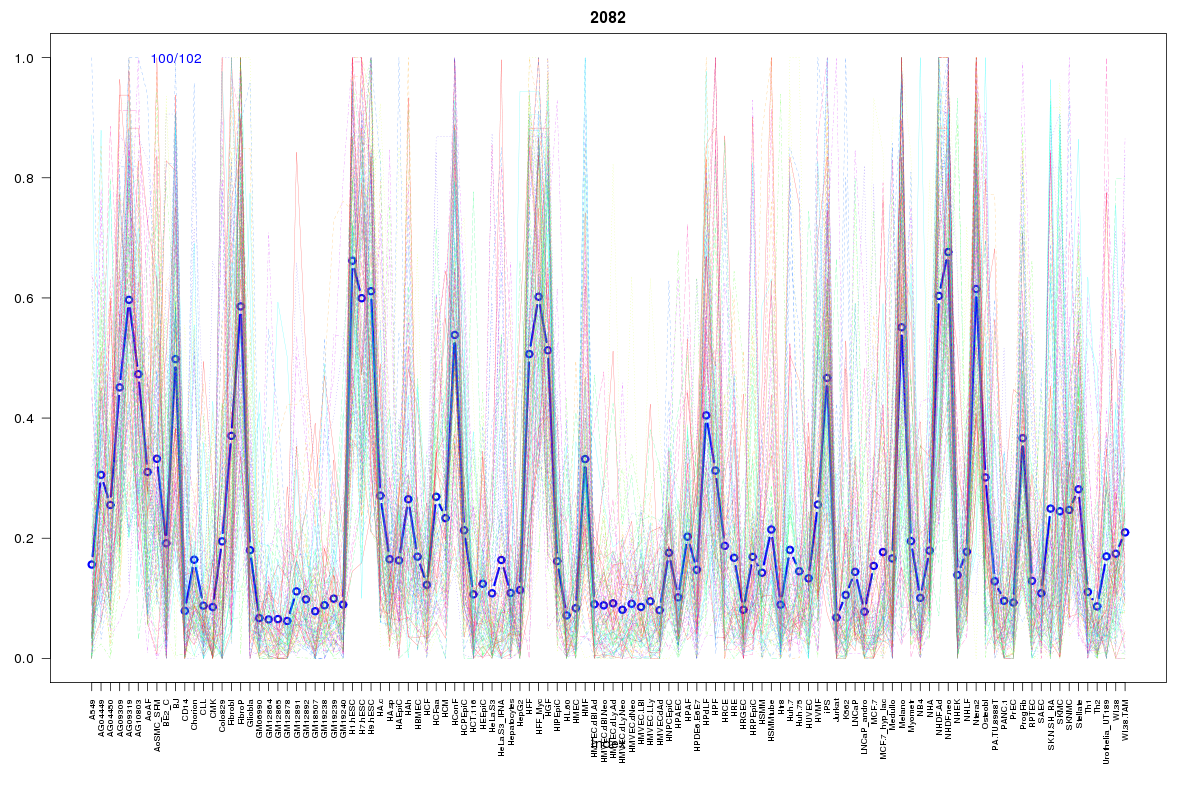
Cluster Hypersensitivity Profile

Genomic Location Trend
These plots show the distribution of the DHS sites surrounding the Transcript Start Site of the nearest gene.
Stats
Number of sites: 102Promoter: 14%
CpG-Island: 12%
Conserved: 62%
Enriched Motifs & Matches
Match Detail: [Jaspar]
|
| ||
|---|---|---|
| Sites: 36/100 | e-val: 3.9e-23 | ||
| Factor | e-val(match) | DB |
| SP1 | 0.00000000042858 | JASPAR |
| EWSR1-FLI1 | 0.00000098926 | JASPAR |
| Pax4 | 0.000025794 | JASPAR |
| RREB1 | 0.000083909 | JASPAR |
| Klf4 | 0.0063495 | JASPAR |
BED file downloads
Top 10 Example Regions
| Location | Gene Link | Dist. |
|---|---|---|
| chr9: 132427800-132427950 | PRRX2 | 42.19 |
| chr9: 132427800-132427950 | C9orf50 | 42.19 |
| chr1: 203444760-203444910 | PRELP | 48.83 |
| chr3: 141112100-141112250 | RP11-438D8.2 | 49.49 |
| chr1: 156676620-156676770 | CRABP2 | 58.25 |
| chr1: 156676620-156676770 | RP11-284F21.7 | 58.25 |
| chr20: 30183485-30183635 | ID1 | 60.79 |
| chr11: 66080820-66080970 | B3GNT1 | 66.82 |
| chr11: 66080820-66080970 | CNIH2 | 66.82 |
| chr11: 66080820-66080970 | TMEM151A | 66.82 |