SOM cluster: 2076
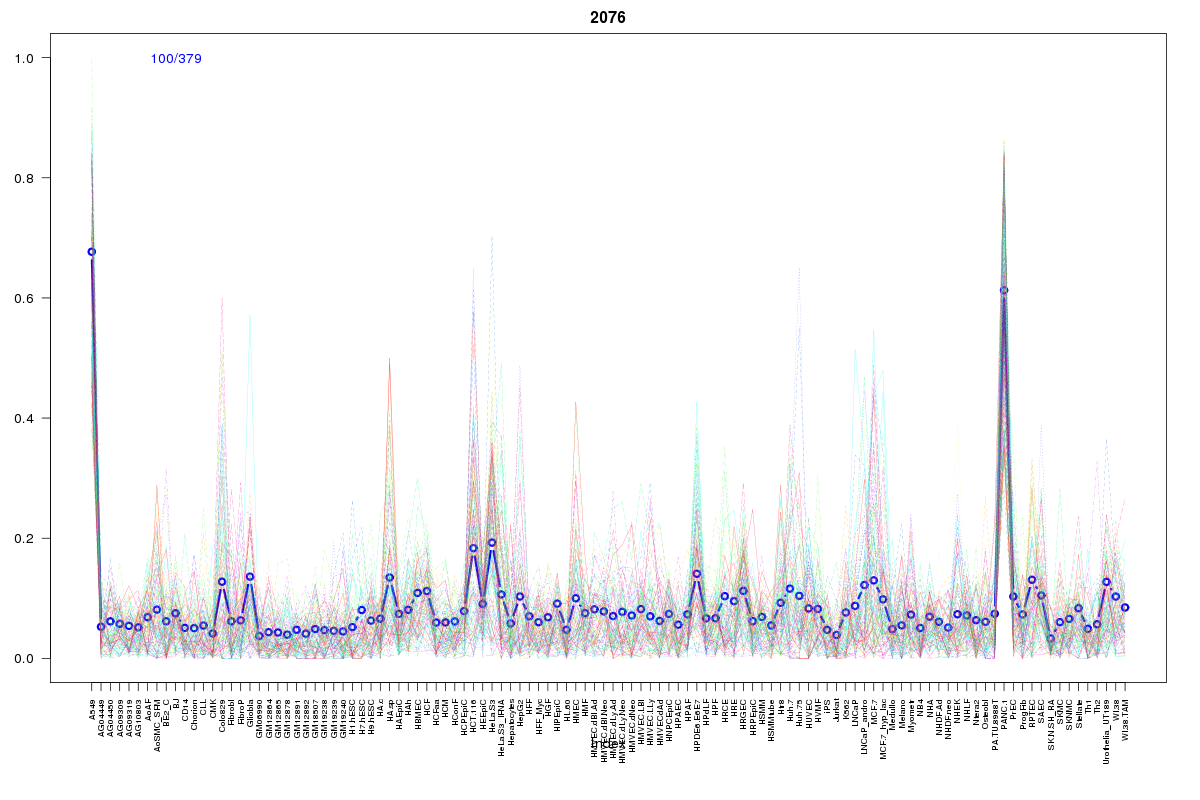
Cluster Hypersensitivity Profile

Genomic Location Trend
These plots show the distribution of the DHS sites surrounding the Transcript Start Site of the nearest gene.
Stats
Number of sites: 379Promoter: 7%
CpG-Island: 0%
Conserved: 27%
Enriched Motifs & Matches
Match Detail: [Jaspar]
|
| ||
|---|---|---|
| Sites: 21/100 | e-val: 0.059 | ||
| Factor | e-val(match) | DB |
| MEF2A | 0.00012993 | JASPAR |
| FOXA1 | 0.00015506 | JASPAR |
| Foxa2 | 0.00040794 | JASPAR |
| Lhx3 | 0.00041026 | JASPAR |
| Pax4 | 0.0010717 | JASPAR |
BED file downloads
Top 10 Example Regions
| Location | Gene Link | Dist. |
|---|---|---|
| chr19: 38794460-38794610 | SIPA1L3 | 10.28 |
| chr19: 38794460-38794610 | FAM98C | 10.28 |
| chr19: 38794460-38794610 | SPINT2 | 10.28 |
| chr19: 38794460-38794610 | KCNK6 | 10.28 |
| chr19: 38794460-38794610 | YIF1B | 10.28 |
| chr1: 151518160-151518310 | SNX27 | 41.12 |
| chr19: 39561760-39561910 | PAK4 | 41.73 |
| chr17: 70462180-70462330 | LINC00511 | 43.89 |
| chr3: 149105305-149105455 | RP11-278L15.4 | 44.35 |
| chr12: 119884380-119884530 | RP11-768F21.1 | 48.41 |