SOM cluster: 2064
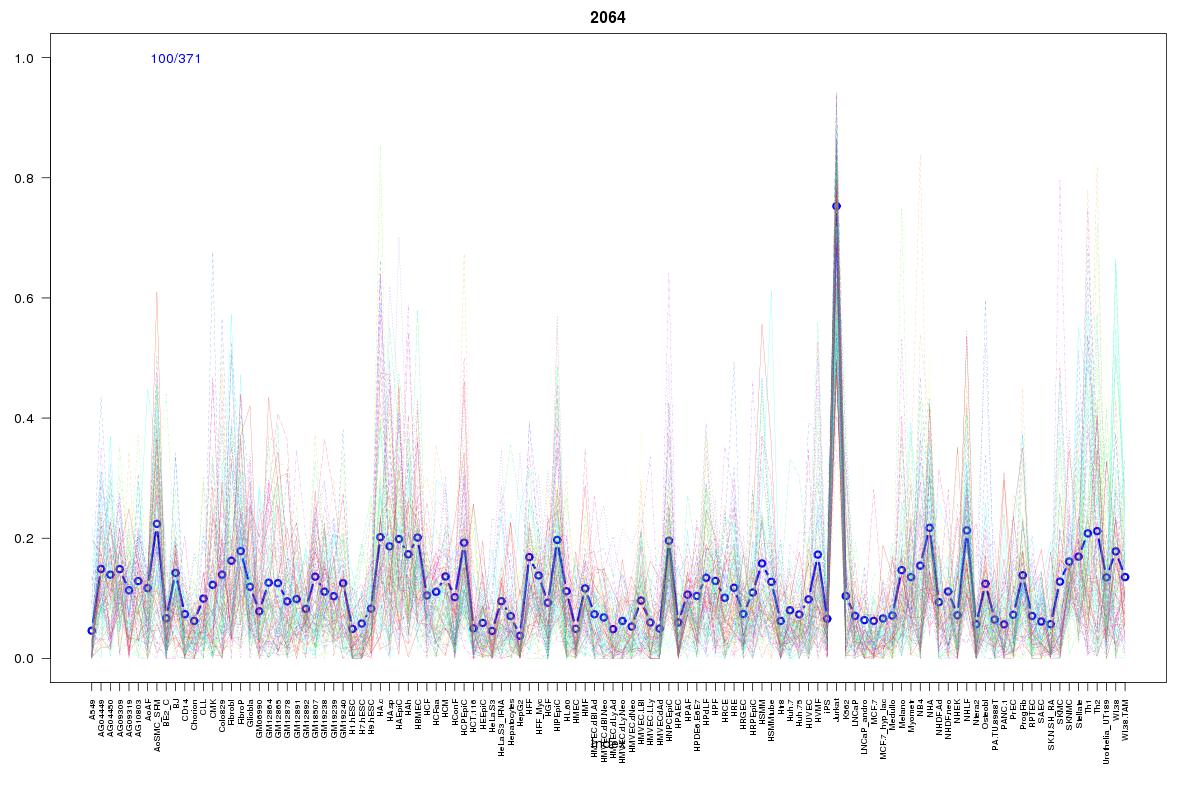
Cluster Hypersensitivity Profile

Genomic Location Trend
These plots show the distribution of the DHS sites surrounding the Transcript Start Site of the nearest gene.
Stats
Number of sites: 371Promoter: 1%
CpG-Island: 0%
Conserved: 46%
Enriched Motifs & Matches
Match Detail: [Jaspar]
|
| ||
|---|---|---|
| Sites: 37/100 | e-val: 3.4e-17 | ||
| Factor | e-val(match) | DB |
| RUNX1 | 0.00000048832 | JASPAR |
| RREB1 | 0.00088057 | JASPAR |
| ZNF354C | 0.0018689 | JASPAR |
| MYC::MAX | 0.013963 | JASPAR |
| Tcfcp2l1 | 0.014497 | JASPAR |
|
| ||
| Sites: 19/100 | e-val: 0.21 | ||
| Factor | e-val(match) | DB |
| Foxd3 | 0.0000000044061 | JASPAR |
| FOXI1 | 0.000000024677 | JASPAR |
| FOXA1 | 0.00000072824 | JASPAR |
| Foxq1 | 0.000029512 | JASPAR |
| Foxa2 | 0.00019803 | JASPAR |
BED file downloads
Top 10 Example Regions
| Location | Gene Link | Dist. |
|---|---|---|
| chr8: 124007260-124007410 | DERL1 | 46.48 |
| chr8: 124007260-124007410 | RP11-557C18.3 | 46.48 |
| chr5: 79550600-79550750 | snoU13 | 49.32 |
| chr5: 79550600-79550750 | SERINC5 | 49.32 |
| chrX: 54207660-54207810 | RPL7AP71 | 52.27 |
| chr21: 36264640-36264790 | RUNX1 | 58.16 |
| chr13: 103465040-103465190 | ERCC5 | 58.18 |
| chr13: 103465040-103465190 | BIVM | 58.18 |
| chr2: 160146920-160147070 | WDSUB1 | 58.9 |
| chr1: 53771940-53772090 | RP5-1024G6.5 | 61.45 |