SOM cluster: 2042
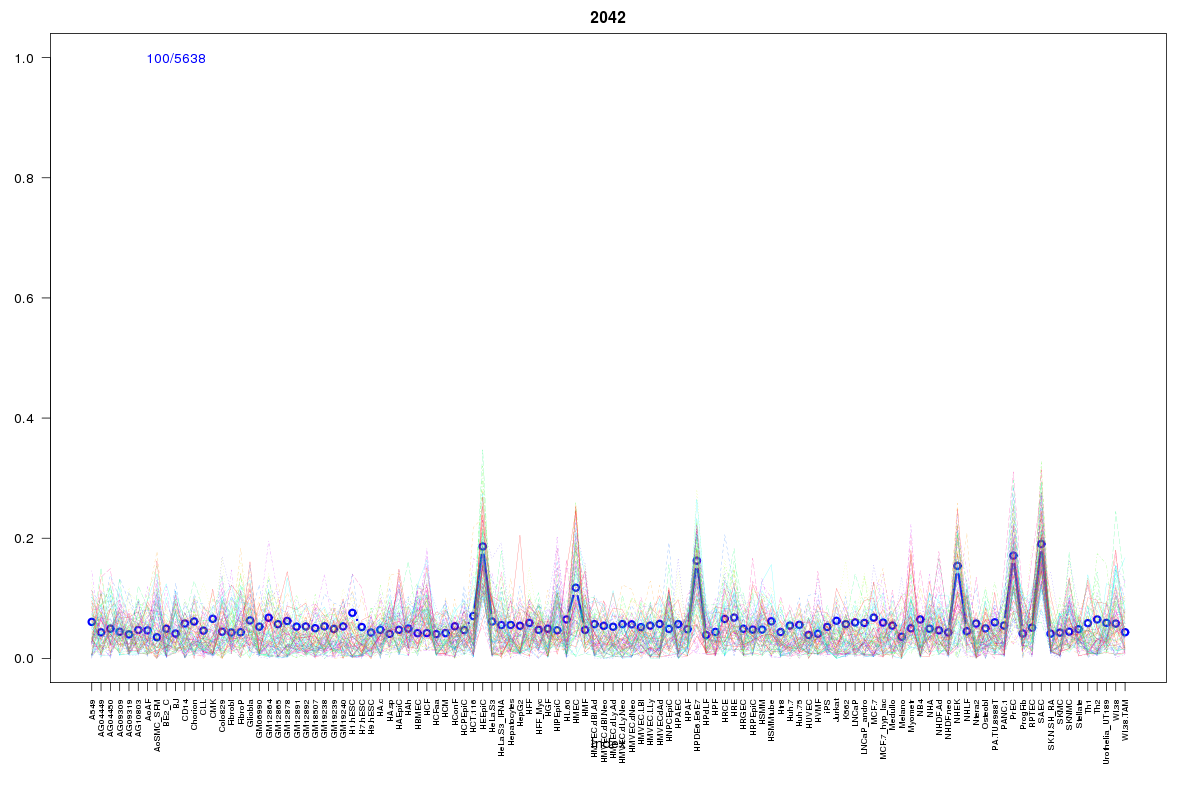
Cluster Hypersensitivity Profile

Genomic Location Trend
These plots show the distribution of the DHS sites surrounding the Transcript Start Site of the nearest gene.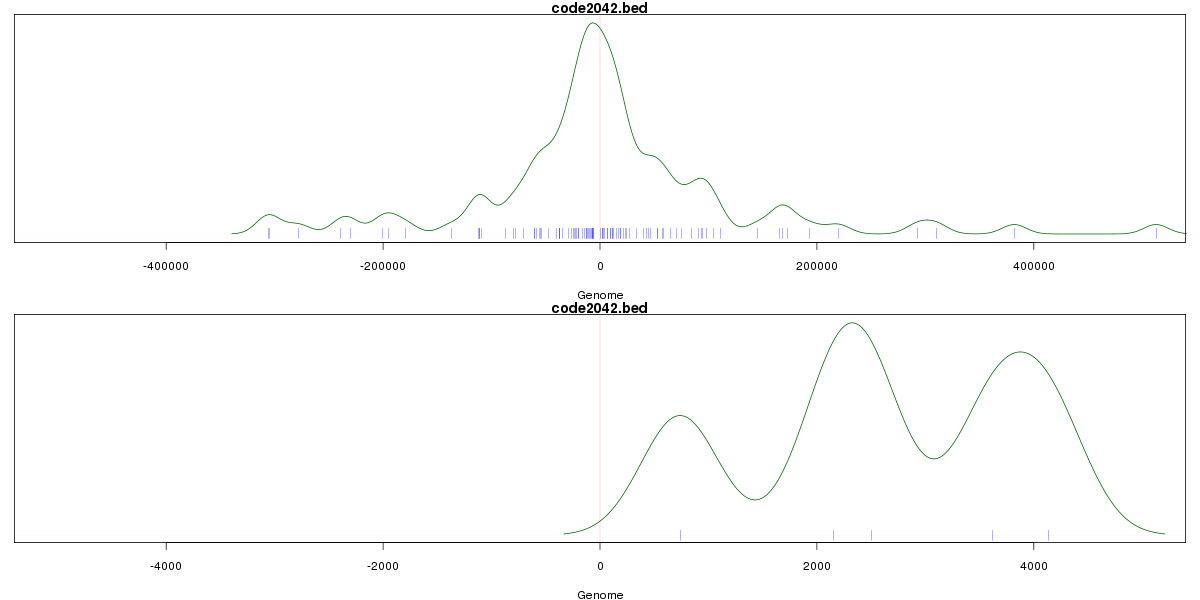
Stats
Number of sites: 5638Promoter: 0%
CpG-Island: 0%
Conserved: 19%
Enriched Motifs & Matches
Match Detail: [Jaspar]
|
| ||
|---|---|---|
| Sites: 24/100 | e-val: 2.9 | ||
| Factor | e-val(match) | DB |
| AP1 | 0.000000011184 | JASPAR |
| NFE2L2 | 0.000000053715 | JASPAR |
| NFE2L1::MafG | 0.0004195 | JASPAR |
| PBX1 | 0.012952 | JASPAR |
| Pax6 | 0.020624 | JASPAR |
BED file downloads
Top 10 Example Regions
| Location | Gene Link | Dist. |
|---|---|---|
| chr1: 147225325-147225475 | GJA5 | 13.02 |
| chr1: 147225325-147225475 | RP11-433J22.2 | 13.02 |
| chr1: 146673045-146673195 | PRKAB2 | 13.06 |
| chr8: 124191780-124191930 | FAM83A | 32.82 |
| chr8: 124191780-124191930 | FAM83A-AS1 | 32.82 |
| chr15: 101417565-101417715 | ALDH1A3 | 33.19 |
| chr1: 209783445-209783595 | RP1-272L16.1 | 33.55 |
| chr7: 149413620-149413770 | KRBA1 | 34.97 |
| chr8: 134253485-134253635 | NDRG1 | 41.06 |
| chr4: 28677300-28677450 | RN7SL101P | 41.83 |