SOM cluster: 2032
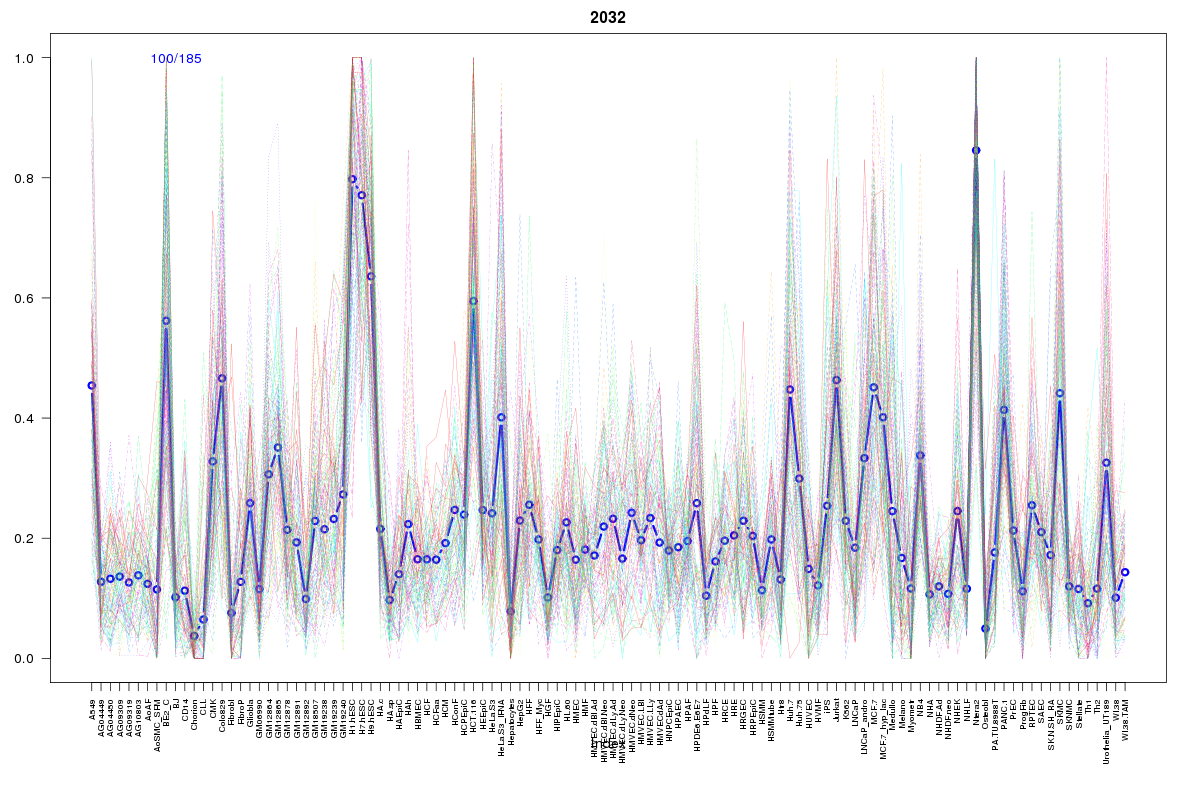
Cluster Hypersensitivity Profile

Genomic Location Trend
These plots show the distribution of the DHS sites surrounding the Transcript Start Site of the nearest gene.
Stats
Number of sites: 185Promoter: 1%
CpG-Island: 0%
Conserved: 39%
Enriched Motifs & Matches
Match Detail: [Jaspar]
|
| ||
|---|---|---|
| Sites: 47/100 | e-val: 3.7e-25 | ||
| Factor | e-val(match) | DB |
| CTCF | 0 | JASPAR |
| INSM1 | 0.000006928 | JASPAR |
| Zfp423 | 0.0018746 | JASPAR |
| TAL1::TCF3 | 0.0077235 | JASPAR |
| SP1 | 0.0086886 | JASPAR |
BED file downloads
Top 10 Example Regions
| Location | Gene Link | Dist. |
|---|---|---|
| chr8: 87570520-87570670 | WWP1 | 48.85 |
| chr3: 36885280-36885430 | AC011816.1 | 55.6 |
| chr3: 152552360-152552510 | P2RY1 | 60.35 |
| chr5: 27472300-27472450 | LINC01021 | 71.78 |
| chrX: 109686020-109686170 | RGAG1 | 76.11 |
| chr3: 148445200-148445350 | AGTR1 | 78.06 |
| chr3: 192908400-192908550 | HRASLS | 79.36 |
| chrX: 38034520-38034670 | RP13-43E11.1 | 79.96 |
| chr22: 33599280-33599430 | LARGE | 80.37 |
| chr16: 24510660-24510810 | RBBP6 | 82.79 |