SOM cluster: 2029
Cluster Hypersensitivity Profile

Genomic Location Trend
These plots show the distribution of the DHS sites surrounding the Transcript Start Site of the nearest gene.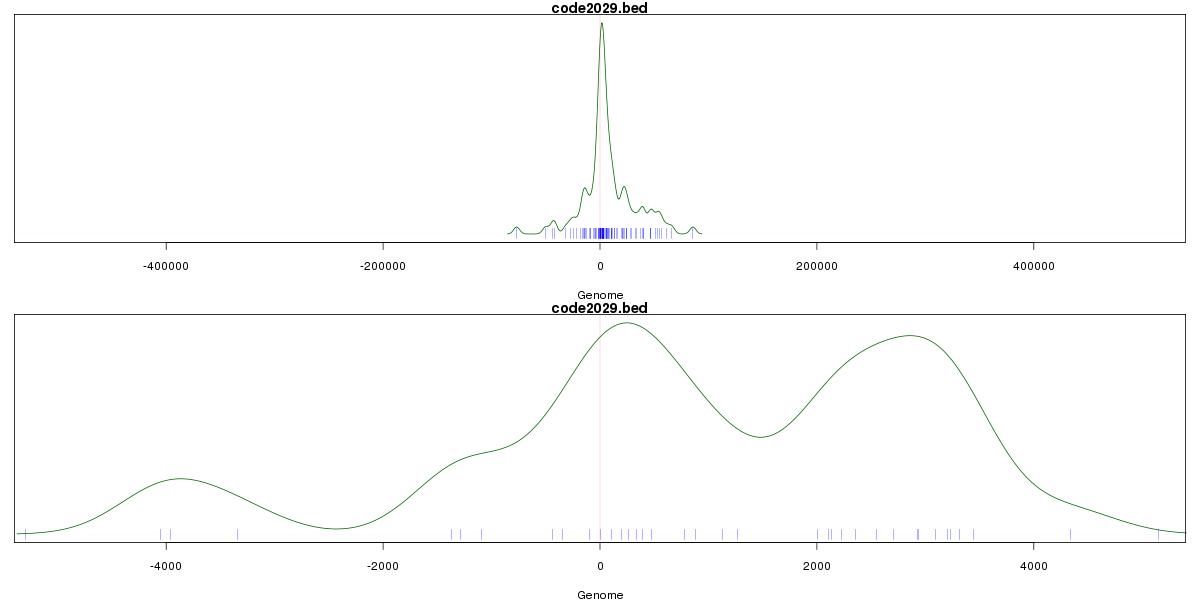
Stats
Number of sites: 196Promoter: 7%
CpG-Island: 12%
Conserved: 43%
Enriched Motifs & Matches
Match Detail: [Jaspar]
|
| ||
|---|---|---|
| Sites: 35/100 | e-val: 1.4e-21 | ||
| Factor | e-val(match) | DB |
| Pax4 | 0.00000000022006 | JASPAR |
| SP1 | 0.0000000026097 | JASPAR |
| EWSR1-FLI1 | 0.0000034526 | JASPAR |
| Tal1::Gata1 | 0.00043956 | JASPAR |
| RREB1 | 0.00081821 | JASPAR |
|
| ||
| Sites: 27/100 | e-val: 0.000000069 | ||
| Factor | e-val(match) | DB |
| Klf4 | 0.000000026605 | JASPAR |
| SP1 | 0.00000024363 | JASPAR |
| PLAG1 | 0.0000082491 | JASPAR |
| Mycn | 0.000088991 | JASPAR |
| RREB1 | 0.00078279 | JASPAR |
|
| ||
| Sites: 28/100 | e-val: 0.0018 | ||
| Factor | e-val(match) | DB |
| SP1 | 0.000039798 | JASPAR |
| PLAG1 | 0.0005262 | JASPAR |
| RREB1 | 0.00057367 | JASPAR |
| MZF1_5-13 | 0.0023341 | JASPAR |
| Klf4 | 0.0028212 | JASPAR |
BED file downloads
Top 10 Example Regions
| Location | Gene Link | Dist. |
|---|---|---|
| chr3: 44666265-44666415 | ZNF197 | 48.87 |
| chr11: 47207020-47207170 | RP11-17G12.3 | 51.84 |
| chr11: 47207020-47207170 | NR1H3 | 51.84 |
| chr11: 47207020-47207170 | PACSIN3 | 51.84 |
| chr5: 176102780-176102930 | GPRIN1 | 53.19 |
| chr12: 49691265-49691415 | TROAP | 54.01 |
| chr17: 41869080-41869230 | MPP2 | 59.4 |
| chr17: 41869080-41869230 | MPP3 | 59.4 |
| chr19: 51152900-51153050 | SYT3 | 59.41 |
| chr19: 7571160-7571310 | CAMSAP3 | 61.13 |