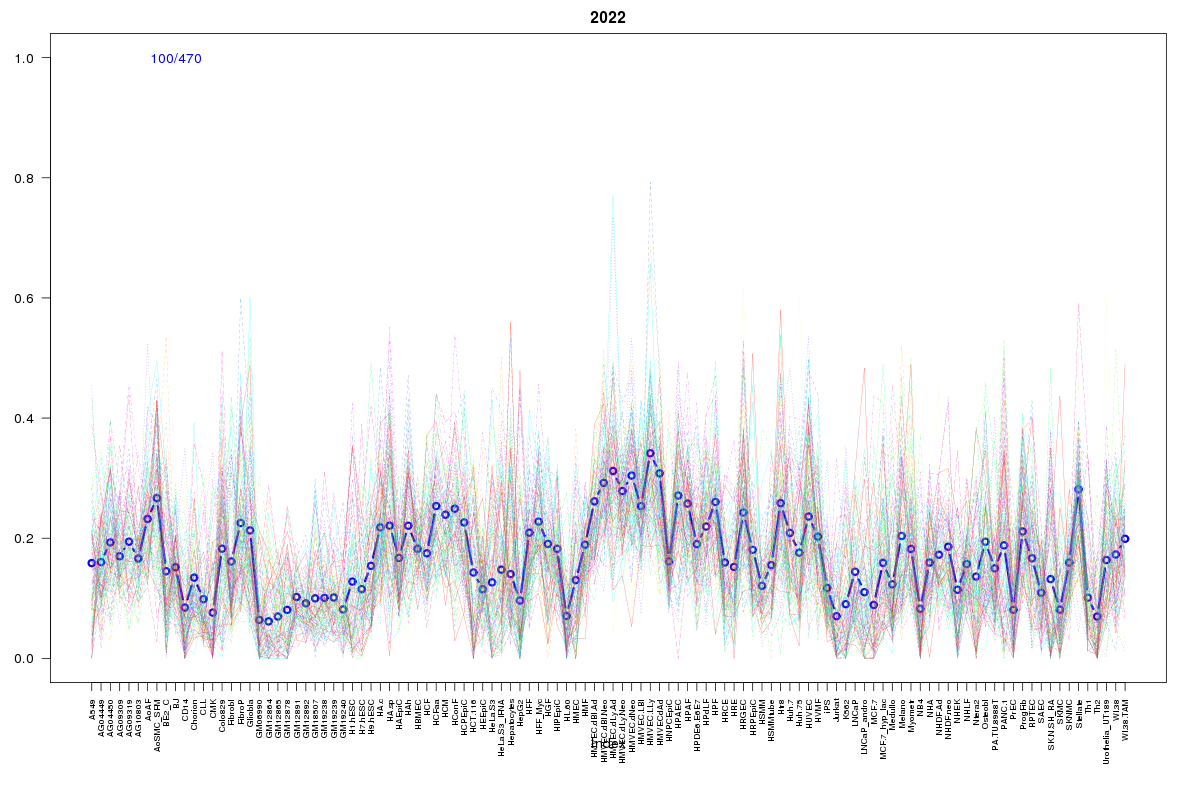
SOM cluster: 2022
Cluster Hypersensitivity Profile

Genomic Location Trend
These plots show the distribution of the DHS sites surrounding the Transcript Start Site of the nearest gene.
Stats
Number of sites: 470Promoter: 22%
CpG-Island: 24%
Conserved: 59%
Enriched Motifs & Matches
Match Detail: [Jaspar]
|
| ||
|---|---|---|
| Sites: 15/100 | e-val: 0.58 | ||
| Factor | e-val(match) | DB |
| Foxq1 | 0.000245 | JASPAR |
| Foxd3 | 0.00085754 | JASPAR |
| IRF1 | 0.0047072 | JASPAR |
| ARID3A | 0.0050052 | JASPAR |
| FOXF2 | 0.0061115 | JASPAR |
BED file downloads
Top 10 Example Regions
| Location | Gene Link | Dist. |
|---|---|---|
| chrX: 135248500-135248650 | MAP7D3 | 40.74 |
| chrX: 135248500-135248650 | snoU13 | 40.74 |
| chrX: 135248500-135248650 | FHL1 | 40.74 |
| chr8: 55051840-55051990 | TDGF1P5 | 44.03 |
| chr19: 10877400-10877550 | ILF3 | 47.04 |
| chr19: 10877400-10877550 | C19orf38 | 47.04 |
| chr19: 20348600-20348750 | ZNF486 | 47.06 |
| chr9: 109625620-109625770 | ZNF462 | 49.85 |
| chr9: 109625620-109625770 | RP11-508N12.4 | 49.85 |
| chr22: 44207700-44207850 | SULT4A1 | 50.14 |