SOM cluster: 202
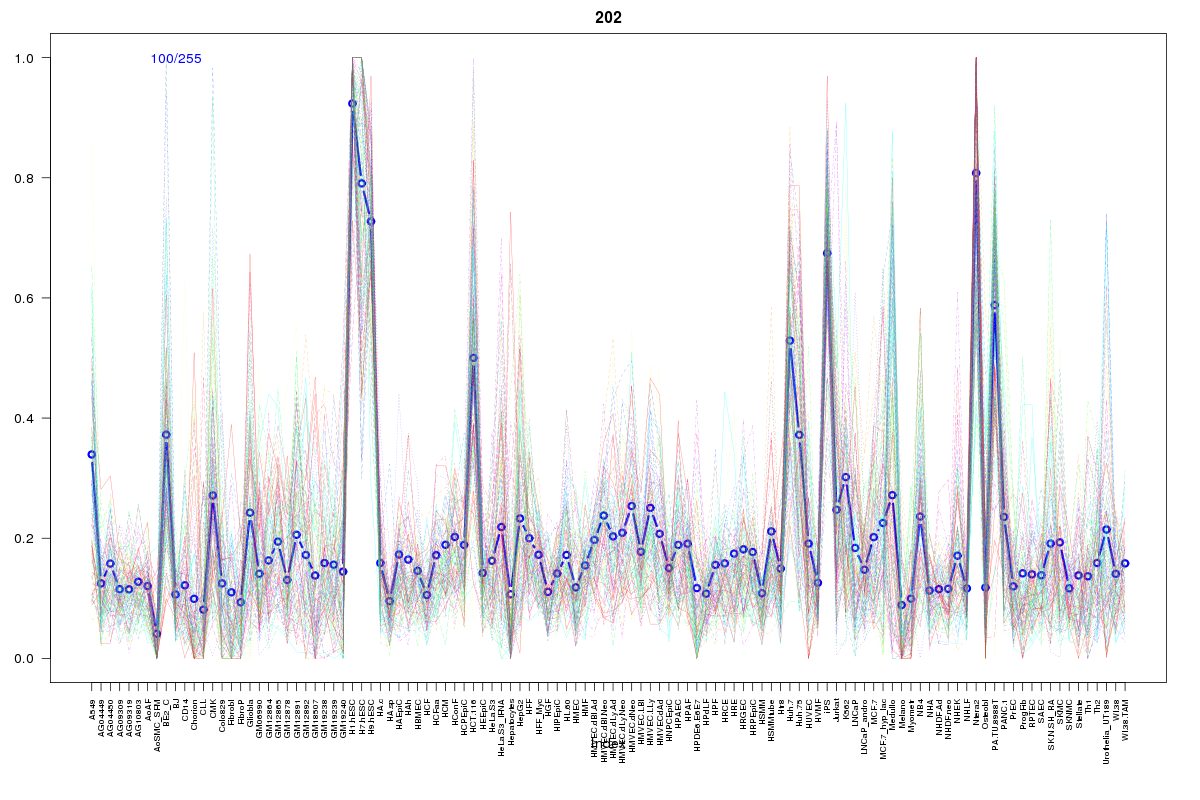
Cluster Hypersensitivity Profile

Genomic Location Trend
These plots show the distribution of the DHS sites surrounding the Transcript Start Site of the nearest gene.
Stats
Number of sites: 255Promoter: 6%
CpG-Island: 11%
Conserved: 30%
Enriched Motifs & Matches
Match Detail: [Jaspar]
|
| ||
|---|---|---|
| Sites: 71/100 | e-val: 0 | ||
| Factor | e-val(match) | DB |
| CTCF | 9.992e-16 | JASPAR |
| INSM1 | 0.0000034242 | JASPAR |
| SP1 | 0.00013759 | JASPAR |
| Zfp423 | 0.00113 | JASPAR |
| PLAG1 | 0.010025 | JASPAR |
|
| ||
| Sites: 45/100 | e-val: 0.11 | ||
| Factor | e-val(match) | DB |
| SP1 | 0.0000011922 | JASPAR |
| Tal1::Gata1 | 0.000084123 | JASPAR |
| Klf4 | 0.00029129 | JASPAR |
| MZF1_5-13 | 0.00056339 | JASPAR |
| Pax4 | 0.0021919 | JASPAR |
|
| ||
| Sites: 24/100 | e-val: 0.066 | ||
| Factor | e-val(match) | DB |
| Hand1::Tcfe2a | 0.0029609 | JASPAR |
| T | 0.00868 | JASPAR |
| INSM1 | 0.0094276 | JASPAR |
| TLX1::NFIC | 0.010339 | JASPAR |
| TFAP2A | 0.01291 | JASPAR |