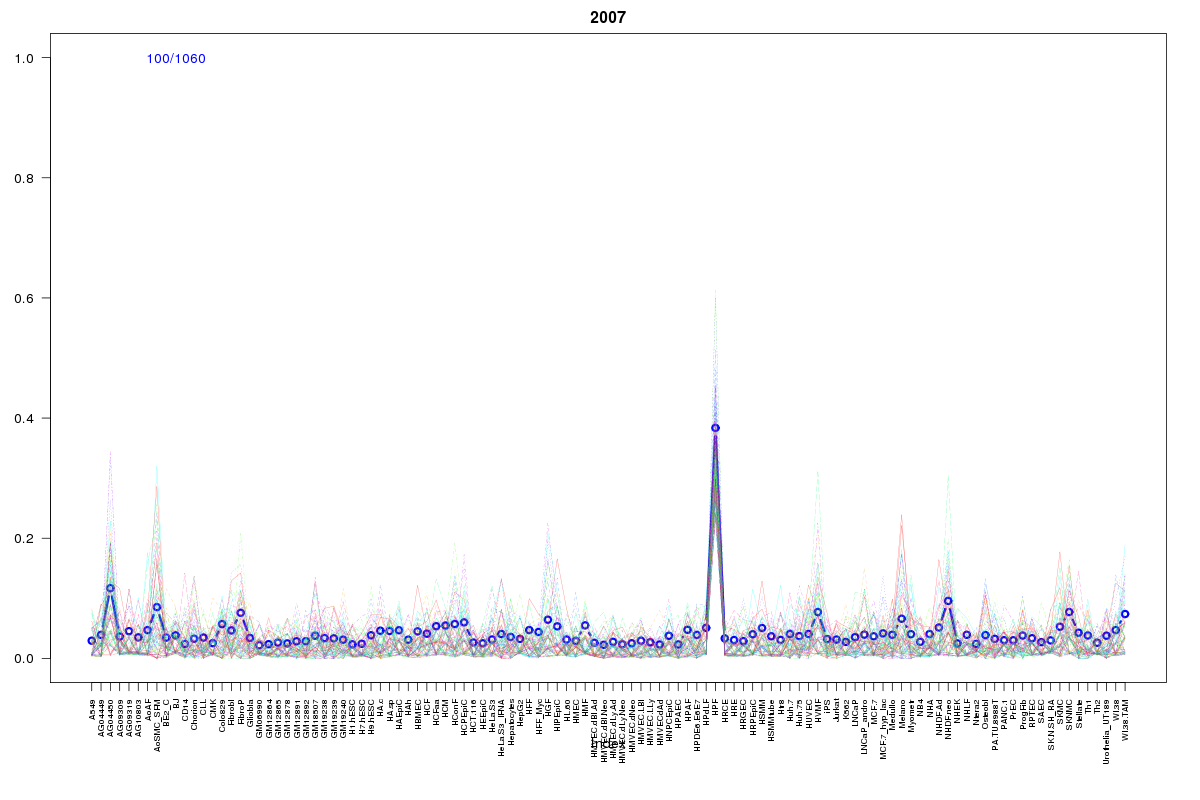
SOM cluster: 2007
Cluster Hypersensitivity Profile

Genomic Location Trend
These plots show the distribution of the DHS sites surrounding the Transcript Start Site of the nearest gene.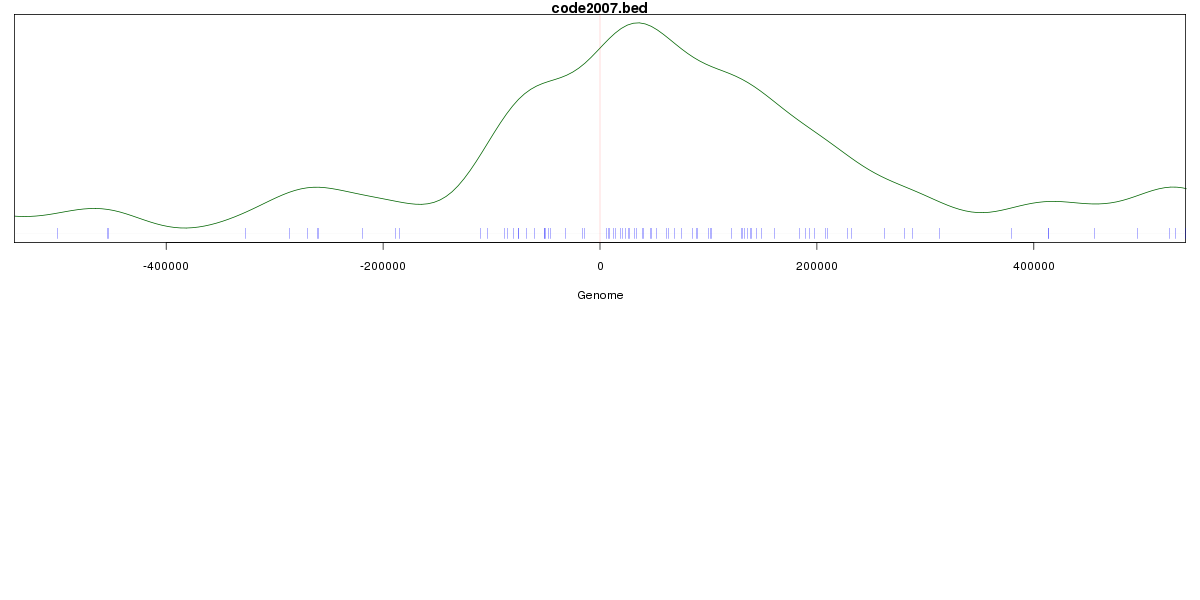
Stats
Number of sites: 1060Promoter: 0%
CpG-Island: 0%
Conserved: 33%
Enriched Motifs & Matches
Match Detail: [Jaspar]
|
| ||
|---|---|---|
| Sites: 47/100 | e-val: 2.5e-16 | ||
| Factor | e-val(match) | DB |
| Foxd3 | 0.0000037643 | JASPAR |
| Foxq1 | 0.0004454 | JASPAR |
| Lhx3 | 0.0062958 | JASPAR |
| Foxa2 | 0.0080676 | JASPAR |
| NFIL3 | 0.0084584 | JASPAR |