SOM cluster: 2006
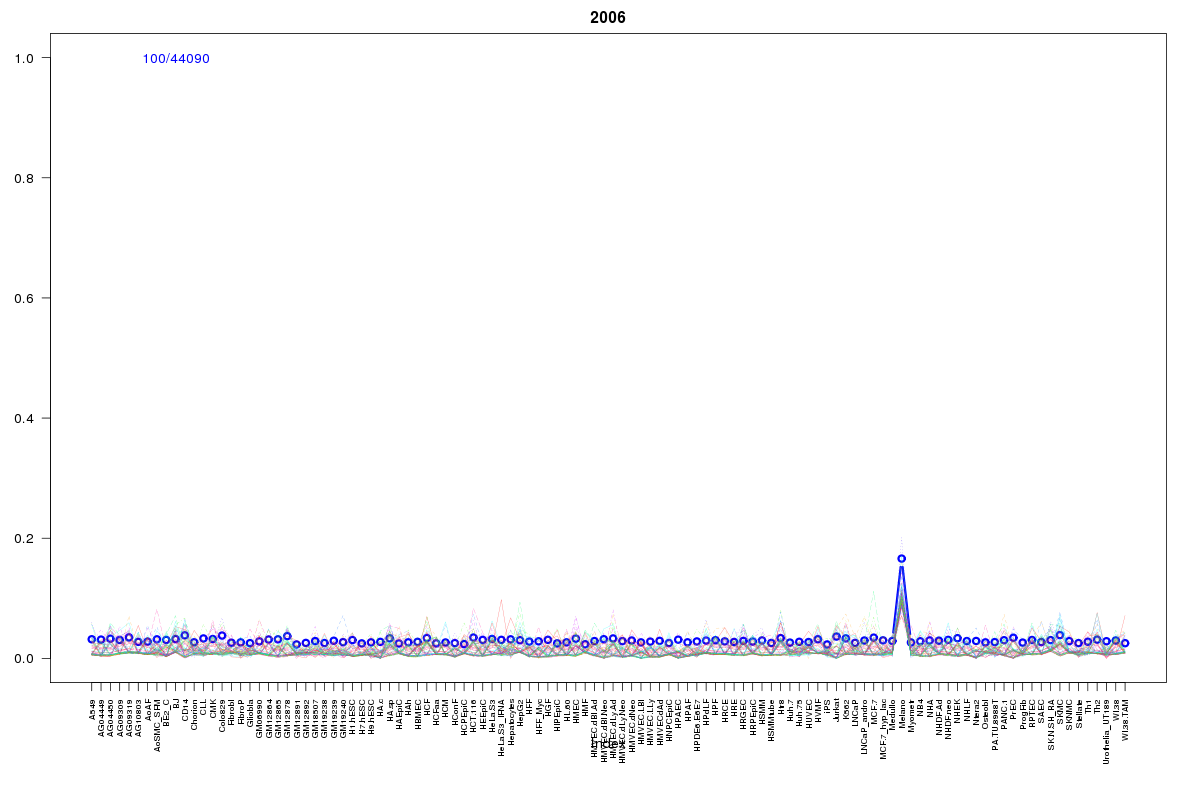
Cluster Hypersensitivity Profile

Genomic Location Trend
These plots show the distribution of the DHS sites surrounding the Transcript Start Site of the nearest gene.
Stats
Number of sites: 44090Promoter: 1%
CpG-Island: 0%
Conserved: 13%
Enriched Motifs & Matches
Match Detail: [Jaspar]
|
| ||
|---|---|---|
| Sites: 37/100 | e-val: 3.5e-17 | ||
| Factor | e-val(match) | DB |
| HNF1A | 0.000053115 | JASPAR |
| Lhx3 | 0.00011515 | JASPAR |
| HNF1B | 0.0018295 | JASPAR |
| Prrx2 | 0.0040572 | JASPAR |
| Evi1 | 0.005972 | JASPAR |
|
| ||
| Sites: 24/100 | e-val: 0.99 | ||
| Factor | e-val(match) | DB |
| Foxq1 | 0.00042134 | JASPAR |
| Prrx2 | 0.00069852 | JASPAR |
| Lhx3 | 0.001737 | JASPAR |
| MEF2A | 0.0018787 | JASPAR |
| NKX3-1 | 0.0019544 | JASPAR |
BED file downloads
Top 10 Example Regions
| Location | Gene Link | Dist. |
|---|---|---|
| chr1: 150297445-150297595 | APH1A | 18.06 |
| chr8: 101493945-101494095 | KB-1615E4.3 | 31.28 |
| chr1: 91937020-91937170 | RP11-47K11.2 | 31.47 |
| chr5: 132231845-132231995 | AC010240.3 | 38.04 |
| chr8: 124334485-124334635 | IMPDH1P6 | 40.18 |
| chr1: 92532785-92532935 | PRKAR1AP | 41.04 |
| chr17: 12662685-12662835 | MYOCD | 43.16 |
| chr4: 178138285-178138435 | RN7SKP136 | 44.14 |
| chr2: 159518725-159518875 | PKP4 | 44.81 |
| chr3: 160230845-160230995 | SMC4 | 45.55 |