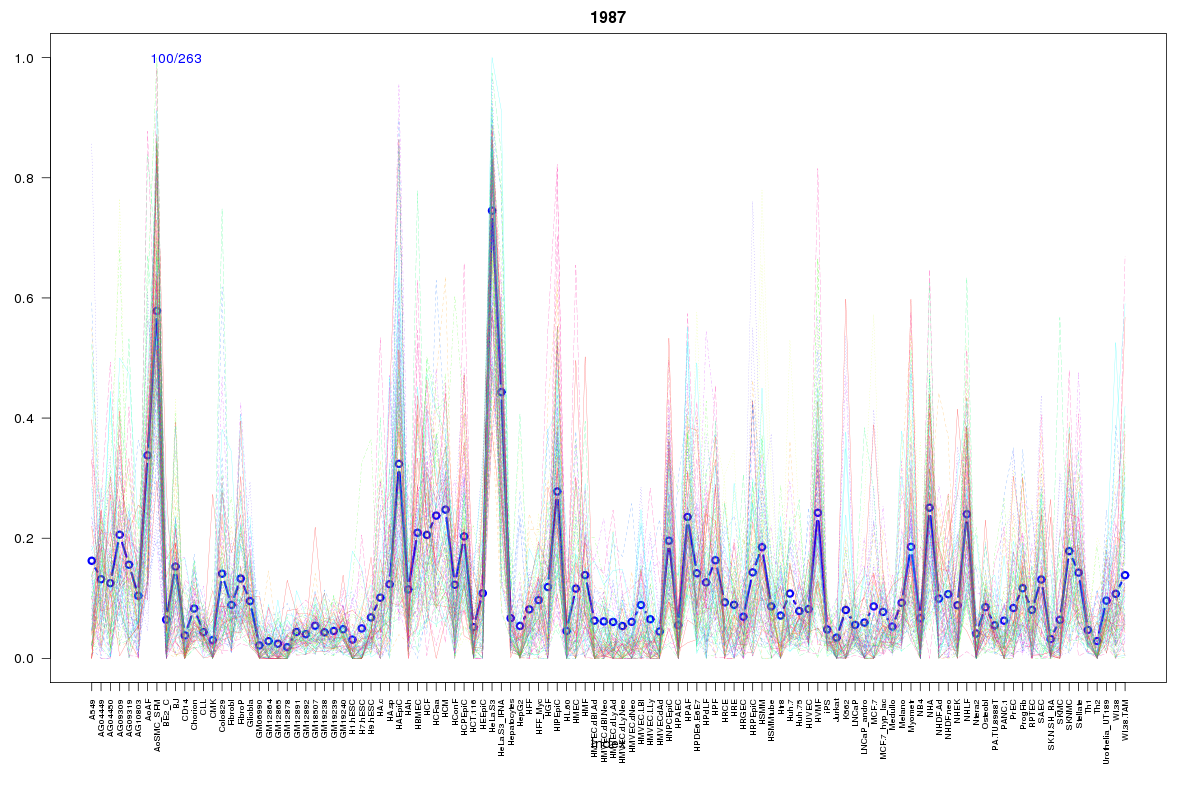
SOM cluster: 1987
Cluster Hypersensitivity Profile

Genomic Location Trend
These plots show the distribution of the DHS sites surrounding the Transcript Start Site of the nearest gene.
Stats
Number of sites: 263Promoter: 1%
CpG-Island: 0%
Conserved: 24%
Enriched Motifs & Matches
Match Detail: [Jaspar]
|
| ||
|---|---|---|
| Sites: 38/100 | e-val: 0.11 | ||
| Factor | e-val(match) | DB |
| Foxd3 | 0.00000015808 | JASPAR |
| FOXA1 | 0.00000023576 | JASPAR |
| Foxa2 | 0.000011316 | JASPAR |
| Foxq1 | 0.00028537 | JASPAR |
| FOXI1 | 0.00034558 | JASPAR |
BED file downloads
Top 10 Example Regions
| Location | Gene Link | Dist. |
|---|---|---|
| chr8: 19484840-19484990 | CSGALNACT1 | 35.81 |
| chr8: 19484840-19484990 | RP11-1105O14.1 | 35.81 |
| chr8: 105961700-105961850 | RP11-200A13.3 | 42.19 |
| chr6: 11012300-11012450 | SMIM13 | 48.84 |
| chr2: 73055360-73055510 | EXOC6B | 57.32 |
| chr1: 24373205-24373355 | SRSF10 | 57.39 |
| chr4: 30905220-30905370 | PCDH7 | 57.82 |
| chr1: 224461600-224461750 | DEGS1 | 59.3 |
| chr4: 39044760-39044910 | RP11-360F5.3 | 66.35 |
| chr4: 39044760-39044910 | KLHL5 | 66.35 |