SOM cluster: 1984
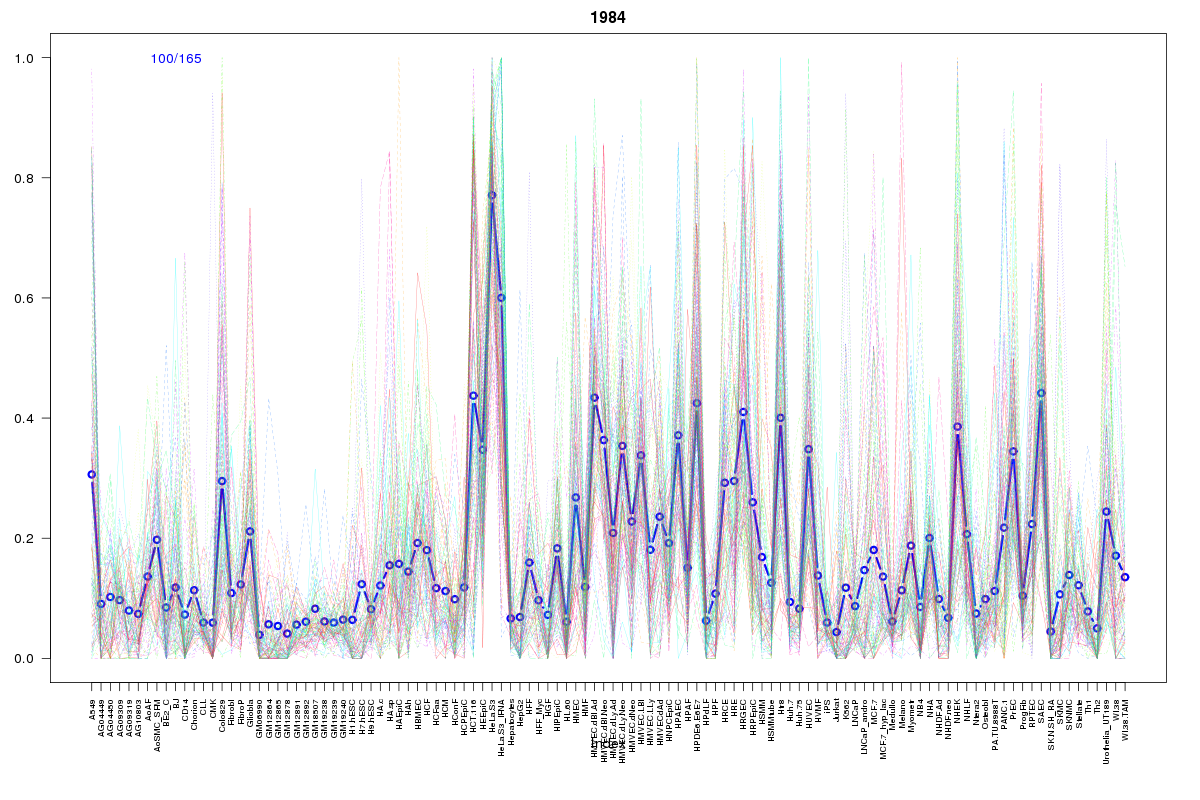
Cluster Hypersensitivity Profile

Genomic Location Trend
These plots show the distribution of the DHS sites surrounding the Transcript Start Site of the nearest gene.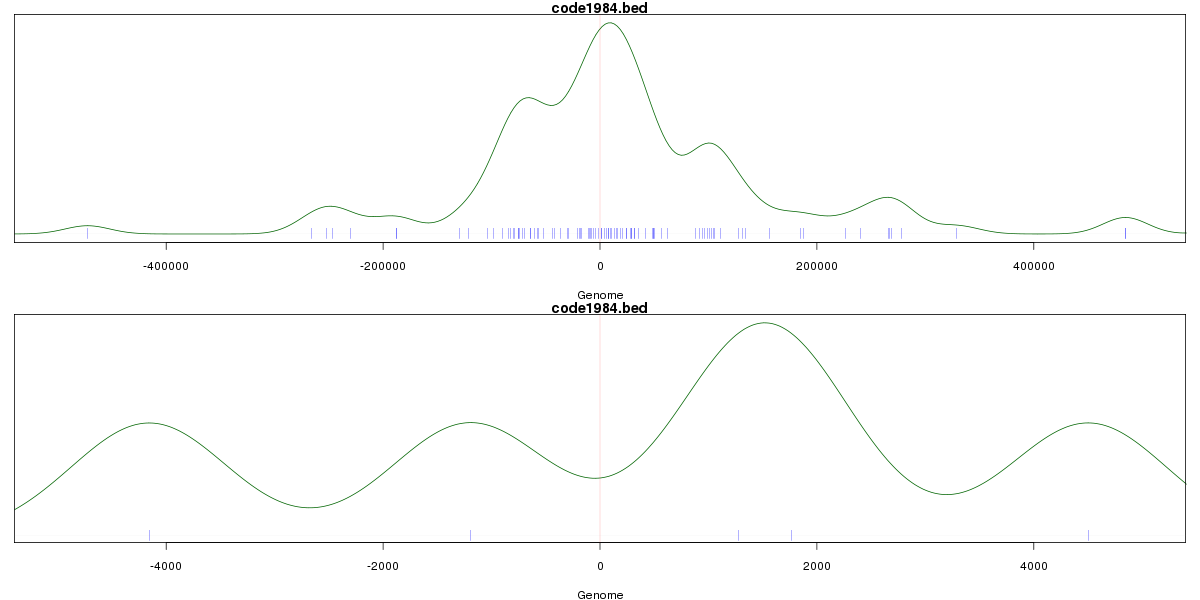
Stats
Number of sites: 165Promoter: 1%
CpG-Island: 0%
Conserved: 40%
Enriched Motifs & Matches
Match Detail: [Jaspar]
|
| ||
|---|---|---|
| Sites: 38/100 | e-val: 6.6e-16 | ||
| Factor | e-val(match) | DB |
| AP1 | 0.00000000062314 | JASPAR |
| NFE2L2 | 0.0000000018071 | JASPAR |
| NFE2L1::MafG | 0.00013192 | JASPAR |
| PBX1 | 0.004904 | JASPAR |
| Pax2 | 0.0098213 | JASPAR |
|
| ||
| Sites: 29/100 | e-val: 0.51 | ||
| Factor | e-val(match) | DB |
| Foxd3 | 0.00018861 | JASPAR |
| Foxa2 | 0.00030749 | JASPAR |
| Foxq1 | 0.0014089 | JASPAR |
| Lhx3 | 0.001447 | JASPAR |
| MEF2A | 0.0019142 | JASPAR |
|
| ||
| Sites: 19/100 | e-val: 0.019 | ||
| Factor | e-val(match) | DB |
| SPI1 | 0.000001072 | JASPAR |
| EWSR1-FLI1 | 0.00002748 | JASPAR |
| FEV | 0.000082635 | JASPAR |
| ELF5 | 0.00035467 | JASPAR |
| SPIB | 0.0017929 | JASPAR |
BED file downloads
Top 10 Example Regions
| Location | Gene Link | Dist. |
|---|---|---|
| chr1: 203725740-203725890 | ZBED6 | 44.41 |
| chr1: 160986480-160986630 | ARHGAP30 | 45.51 |
| chr1: 160986480-160986630 | F11R | 45.51 |
| chr11: 110208600-110208750 | RDX | 45.66 |
| chr4: 130743980-130744130 | EEF1GP8 | 52.42 |
| chr1: 186409780-186409930 | C1orf27 | 68.34 |
| chr4: 79474020-79474170 | ANXA3 | 72.32 |
| chr3: 194751505-194751655 | XXYLT1 | 72.78 |
| chr8: 10568460-10568610 | SOX7 | 73.28 |
| chr3: 69131180-69131330 | FRMD4B | 74.86 |