SOM cluster: 1975
Cluster Hypersensitivity Profile

Genomic Location Trend
These plots show the distribution of the DHS sites surrounding the Transcript Start Site of the nearest gene.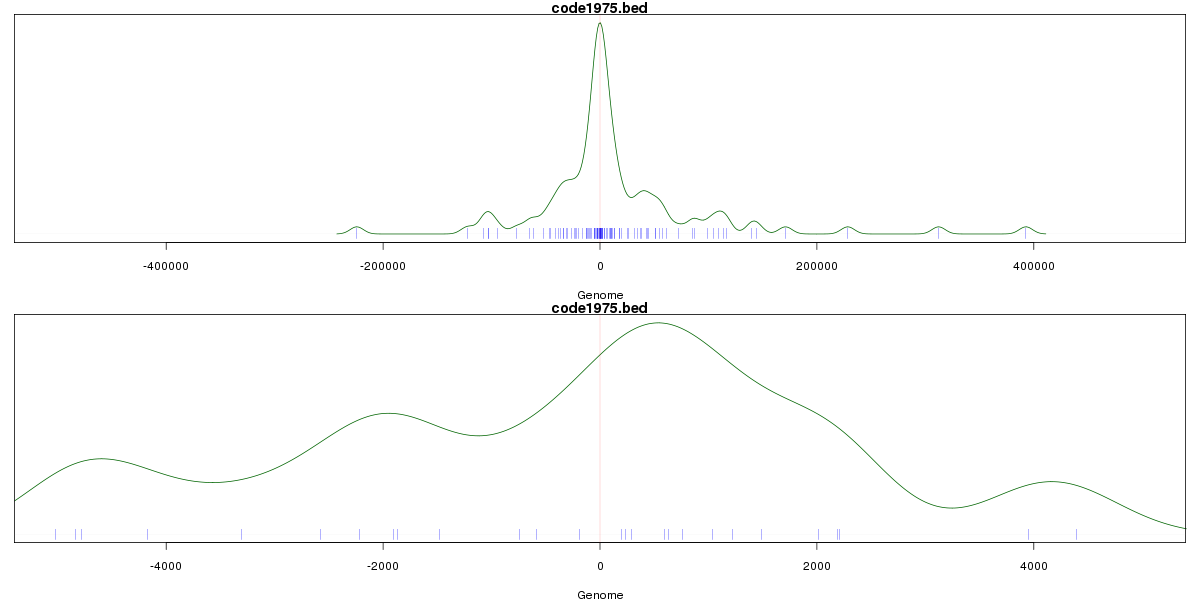
Stats
Number of sites: 244Promoter: 7%
CpG-Island: 0%
Conserved: 27%
Enriched Motifs & Matches
No motifs found.BED file downloads
Top 10 Example Regions
| Location | Gene Link | Dist. |
|---|---|---|
| chr7: 134832560-134832710 | TMEM140 | 25.47 |
| chr17: 15931040-15931190 | NCOR1 | 49.57 |
| chr11: 65239365-65239515 | SCYL1 | 54.56 |
| chr11: 65239365-65239515 | FRMD8 | 54.56 |
| chr7: 130572480-130572630 | MIR29A | 62.01 |
| chr8: 54797160-54797310 | ATP6V1H | 62.12 |
| chr8: 54797160-54797310 | RGS20 | 62.12 |
| chr7: 116151600-116151750 | AC006159.5 | 63.44 |
| chr3: 135861700-135861850 | PPP2R3A | 63.57 |
| chr3: 193807060-193807210 | HES1 | 66.34 |