SOM cluster: 197
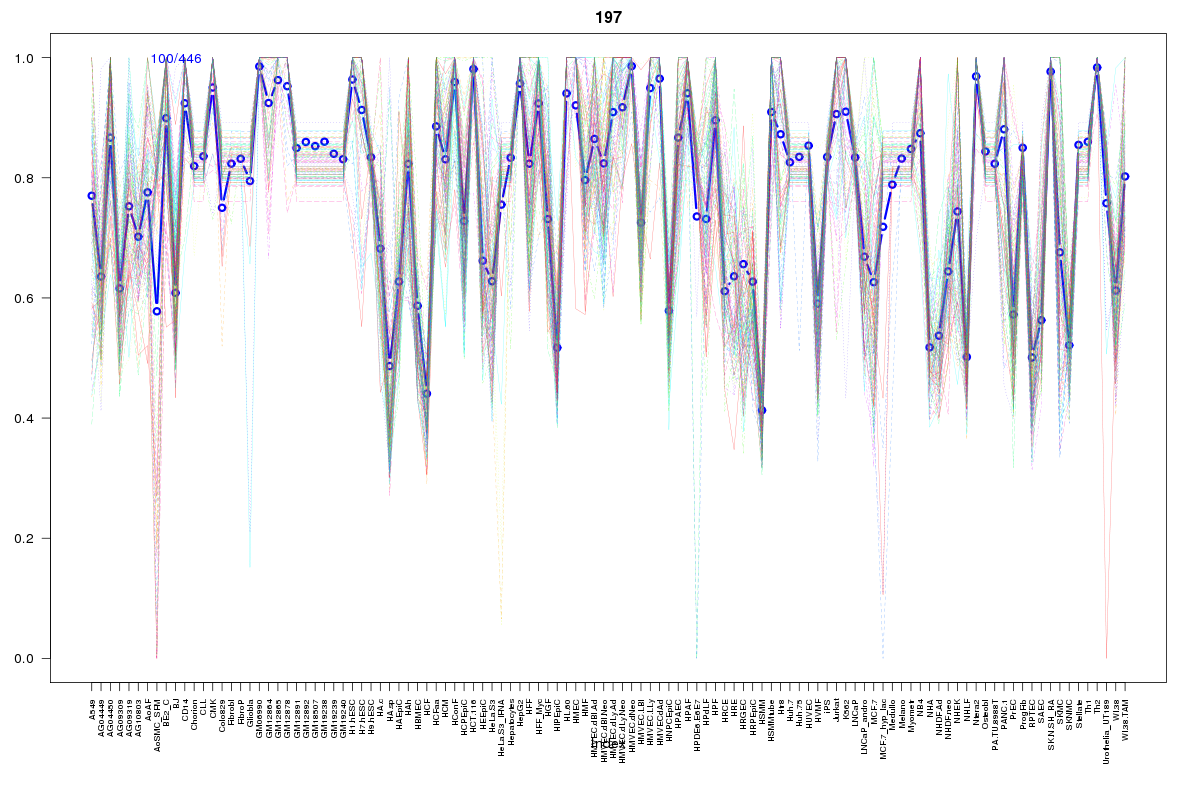
Cluster Hypersensitivity Profile

Genomic Location Trend
These plots show the distribution of the DHS sites surrounding the Transcript Start Site of the nearest gene.
Stats
Number of sites: 446Promoter: 74%
CpG-Island: 88%
Conserved: 83%
Enriched Motifs & Matches
Match Detail: [Jaspar]
|
| ||
|---|---|---|
| Sites: 100/100 | e-val: 0 | ||
| Factor | e-val(match) | DB |
| SP1 | 0.000091148 | JASPAR |
| Egr1 | 0.00072256 | JASPAR |
| NHLH1 | 0.0066965 | JASPAR |
| TFAP2A | 0.016344 | JASPAR |
| Klf4 | 0.017177 | JASPAR |
|
| ||
| Sites: 99/100 | e-val: 0 | ||
| Factor | e-val(match) | DB |
| SP1 | 0.000000015178 | JASPAR |
| Klf4 | 0.000070878 | JASPAR |
| TFAP2A | 0.00049169 | JASPAR |
| Egr1 | 0.0022846 | JASPAR |
| Zfx | 0.0046772 | JASPAR |
BED file downloads
Top 10 Example Regions
| Location | Gene Link | Dist. |
|---|---|---|
| chrX: 48534760-48534910 | SUV39H1 | 39.79 |
| chrX: 48534760-48534910 | AF196970.3 | 39.79 |
| chr11: 57103320-57103470 | TNKS1BP1 | 46.21 |
| chr11: 57103320-57103470 | RP11-872D17.8 | 46.21 |
| chr11: 57103320-57103470 | SLC43A3 | 46.21 |
| chr19: 14016880-14017030 | PODNL1 | 49.93 |
| chr19: 14016880-14017030 | ZSWIM4 | 49.93 |
| chr19: 14016880-14017030 | DCAF15 | 49.93 |
| chr7: 116502320-116502470 | MET | 50.97 |
| chr9: 131464720-131464870 | PKN3 | 60.39 |