SOM cluster: 1968
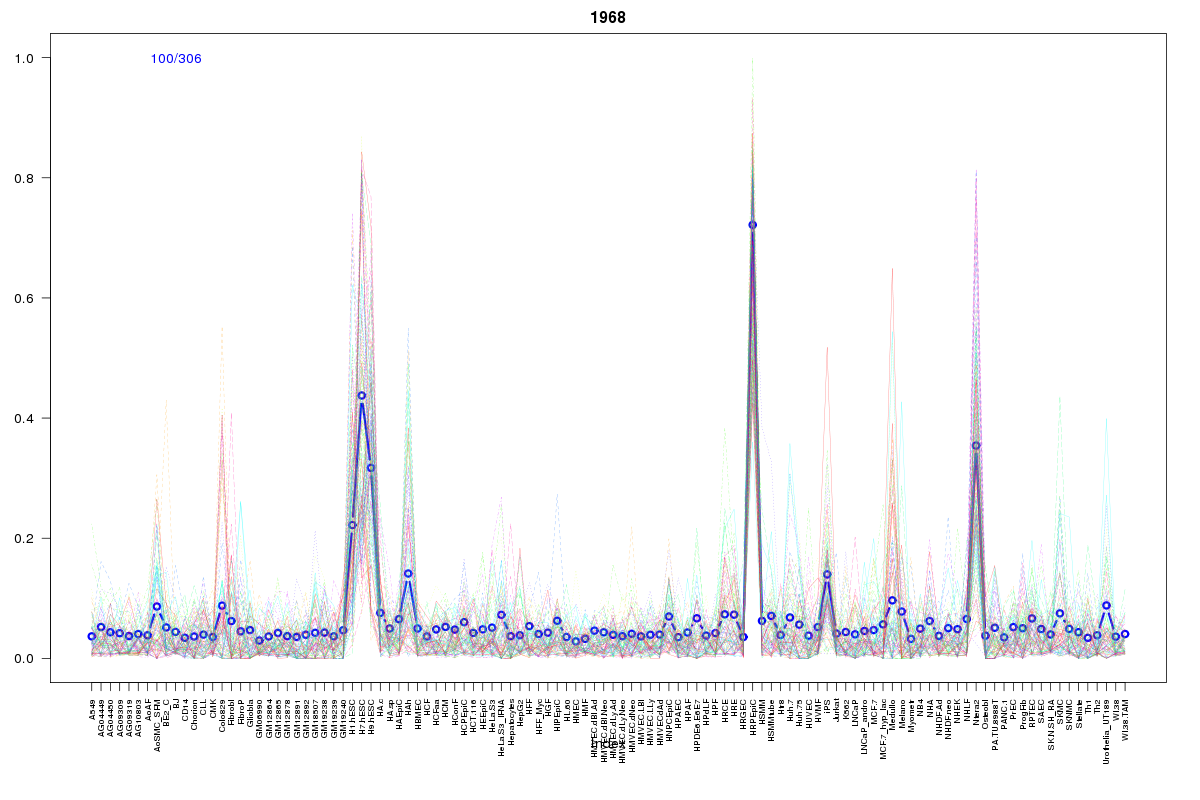
Cluster Hypersensitivity Profile

Genomic Location Trend
These plots show the distribution of the DHS sites surrounding the Transcript Start Site of the nearest gene.
Stats
Number of sites: 306Promoter: 0%
CpG-Island: 0%
Conserved: 42%
Enriched Motifs & Matches
Match Detail: [Jaspar]
|
| ||
|---|---|---|
| Sites: 23/100 | e-val: 0.0025 | ||
| Factor | e-val(match) | DB |
| EWSR1-FLI1 | 0.00000000000010991 | JASPAR |
| TEAD1 | 0.00032635 | JASPAR |
| NR1H2::RXRA | 0.00085588 | JASPAR |
| Spz1 | 0.0028564 | JASPAR |
| Pax4 | 0.0066327 | JASPAR |
BED file downloads
Top 10 Example Regions
| Location | Gene Link | Dist. |
|---|---|---|
| chr11: 66579940-66580090 | SPTBN2 | 56.34 |
| chr11: 66579940-66580090 | RN7SL12P | 56.34 |
| chrX: 9733925-9734075 | GPR143 | 66.13 |
| chr21: 36041140-36041290 | CLIC6 | 68.57 |
| chr18: 46353940-46354090 | SMAD7 | 70.96 |
| chr3: 129079700-129079850 | NUP210P3 | 72.34 |
| chr2: 152899460-152899610 | CACNB4 | 75.96 |
| chr2: 152899460-152899610 | AC079790.2 | 75.96 |
| chr10: 95550380-95550530 | LGI1 | 77.28 |
| chr5: 87955840-87955990 | LINC00461 | 82.06 |