SOM cluster: 1957
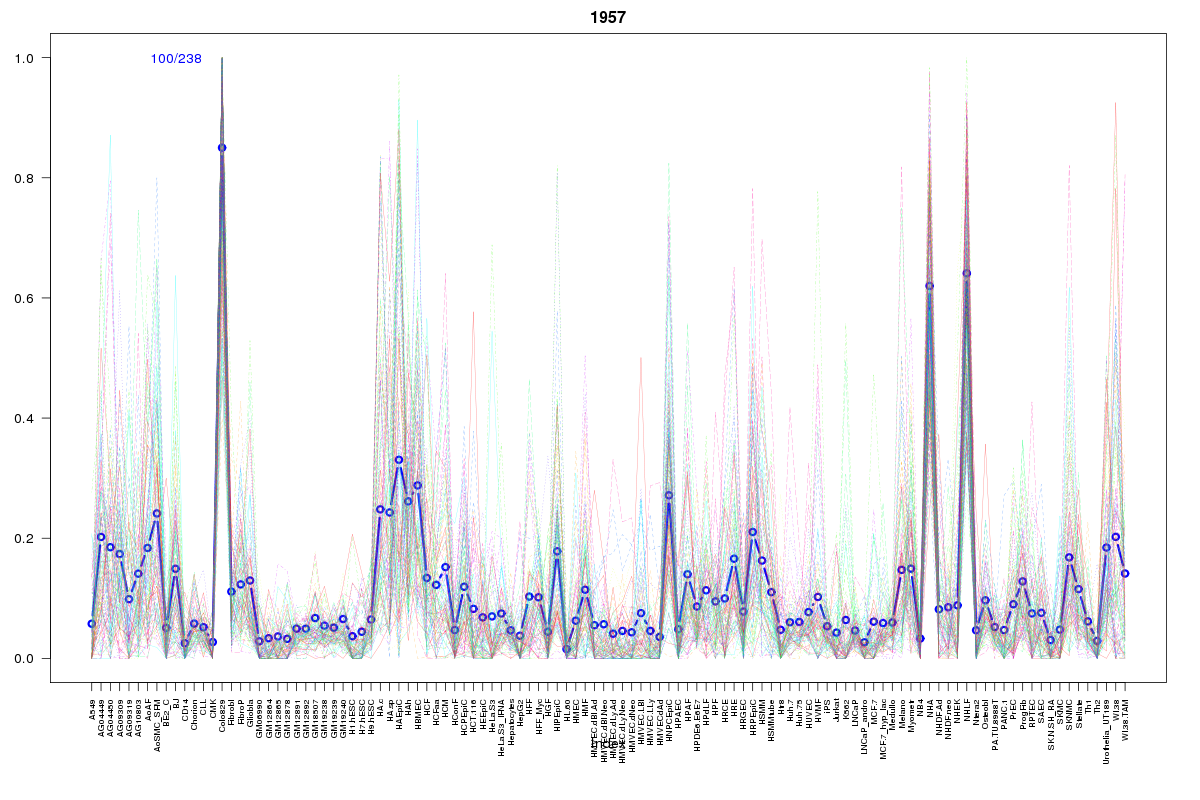
Cluster Hypersensitivity Profile

Genomic Location Trend
These plots show the distribution of the DHS sites surrounding the Transcript Start Site of the nearest gene.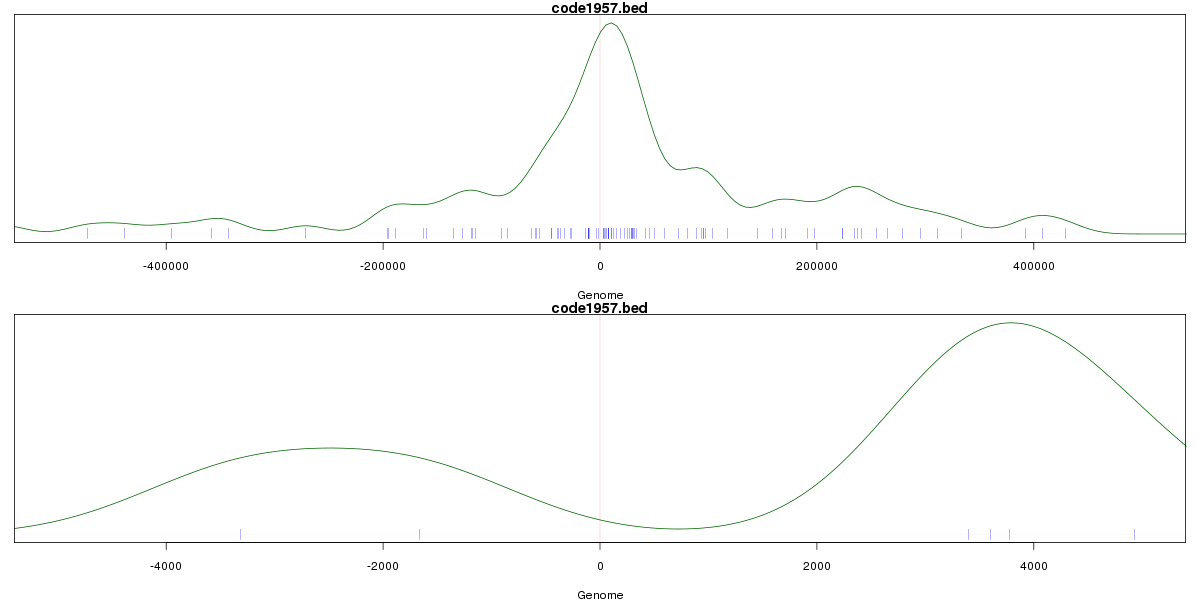
Stats
Number of sites: 238Promoter: 1%
CpG-Island: 0%
Conserved: 42%
Enriched Motifs & Matches
Match Detail: [Jaspar]
|
| ||
|---|---|---|
| Sites: 47/100 | e-val: 0.000000000000017 | ||
| Factor | e-val(match) | DB |
| Foxd3 | 0.000003775 | JASPAR |
| Lhx3 | 0.0019088 | JASPAR |
| Foxq1 | 0.0063647 | JASPAR |
| NR3C1 | 0.012494 | JASPAR |
| FOXI1 | 0.016437 | JASPAR |
|
| ||
| Sites: 38/100 | e-val: 0.0041 | ||
| Factor | e-val(match) | DB |
| AP1 | 0.00000000072814 | JASPAR |
| NFE2L2 | 0.000000093006 | JASPAR |
| NFE2L1::MafG | 0.00056702 | JASPAR |
| PBX1 | 0.0010827 | JASPAR |
| Lhx3 | 0.034738 | JASPAR |
|
| ||
| Sites: 15/100 | e-val: 3 | ||
| Factor | e-val(match) | DB |
| SPI1 | 0.00029289 | JASPAR |
| FEV | 0.00029857 | JASPAR |
| NFATC2 | 0.00036579 | JASPAR |
| SPIB | 0.00085826 | JASPAR |
| Evi1 | 0.0010302 | JASPAR |