SOM cluster: 1944
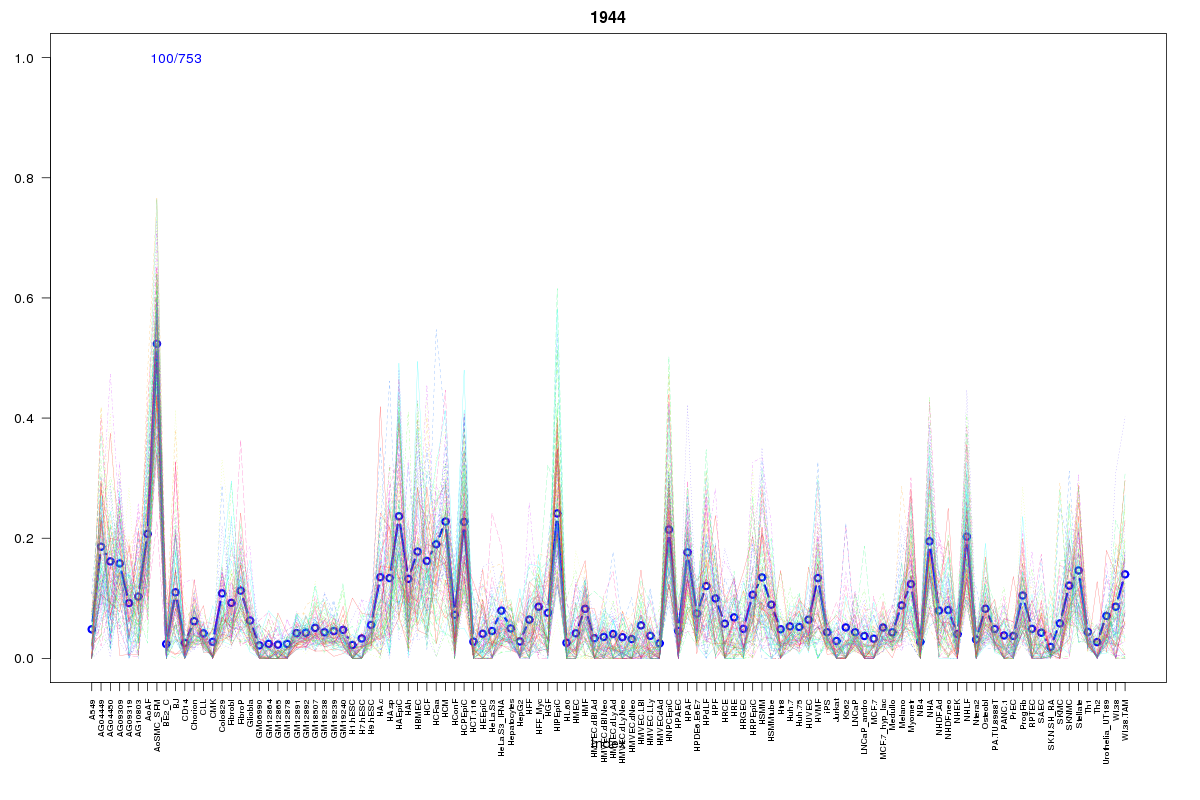
Cluster Hypersensitivity Profile

Genomic Location Trend
These plots show the distribution of the DHS sites surrounding the Transcript Start Site of the nearest gene.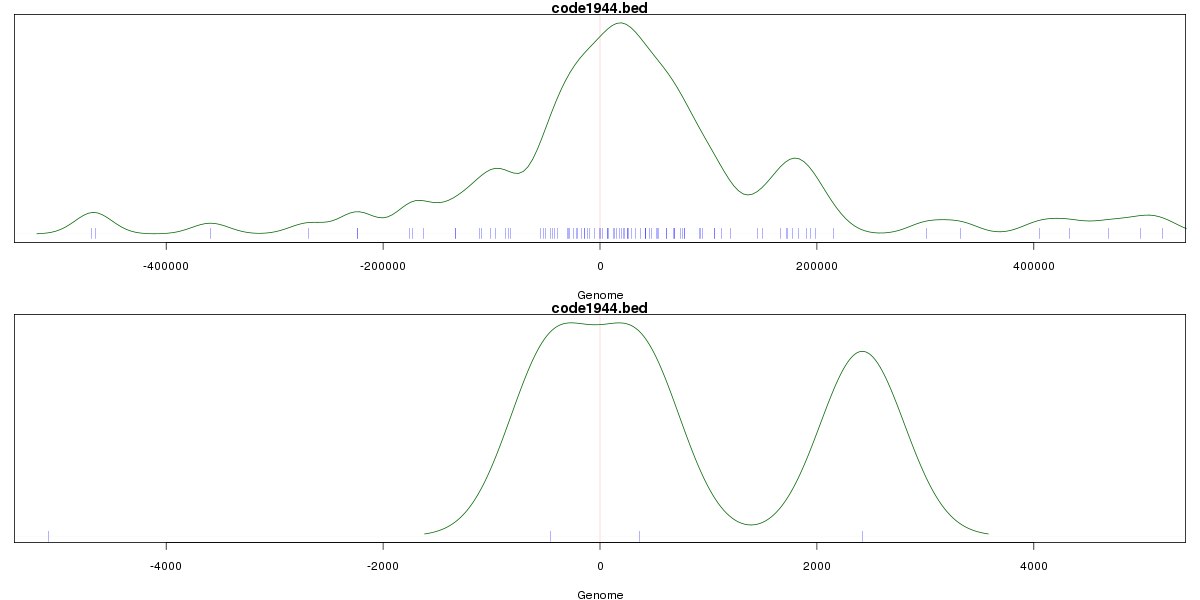
Stats
Number of sites: 753Promoter: 1%
CpG-Island: 0%
Conserved: 25%
Enriched Motifs & Matches
Match Detail: [Jaspar]
|
| ||
|---|---|---|
| Sites: 28/100 | e-val: 0.0000000000033 | ||
| Factor | e-val(match) | DB |
| Lhx3 | 0.00054006 | JASPAR |
| HNF1A | 0.0028021 | JASPAR |
| Pax4 | 0.016878 | JASPAR |
| HNF1B | 0.020139 | JASPAR |
| NR3C1 | 0.022297 | JASPAR |
|
| ||
| Sites: 25/100 | e-val: 0.00003 | ||
| Factor | e-val(match) | DB |
| Foxq1 | 0.00037777 | JASPAR |
| Foxd3 | 0.00050961 | JASPAR |
| Pax4 | 0.0021195 | JASPAR |
| Lhx3 | 0.0055456 | JASPAR |
| NR1H2::RXRA | 0.0076129 | JASPAR |
BED file downloads
Top 10 Example Regions
| Location | Gene Link | Dist. |
|---|---|---|
| chr5: 130691800-130691950 | RAPGEF6 | 37.96 |
| chr5: 130691800-130691950 | FNIP1 | 37.96 |
| chr12: 104309240-104309390 | GLT8D2 | 39.41 |
| chr12: 104686920-104687070 | TXNRD1 | 43.99 |
| chr12: 104686920-104687070 | EID3 | 43.99 |
| chr1: 196357040-196357190 | KCNT2 | 44.13 |
| chr5: 78120680-78120830 | ARSB | 50.09 |
| chr3: 158421480-158421630 | RP11-379F4.4 | 50.11 |
| chr3: 158421480-158421630 | LXN | 50.11 |
| chr3: 158421480-158421630 | RARRES1 | 50.11 |