SOM cluster: 1931
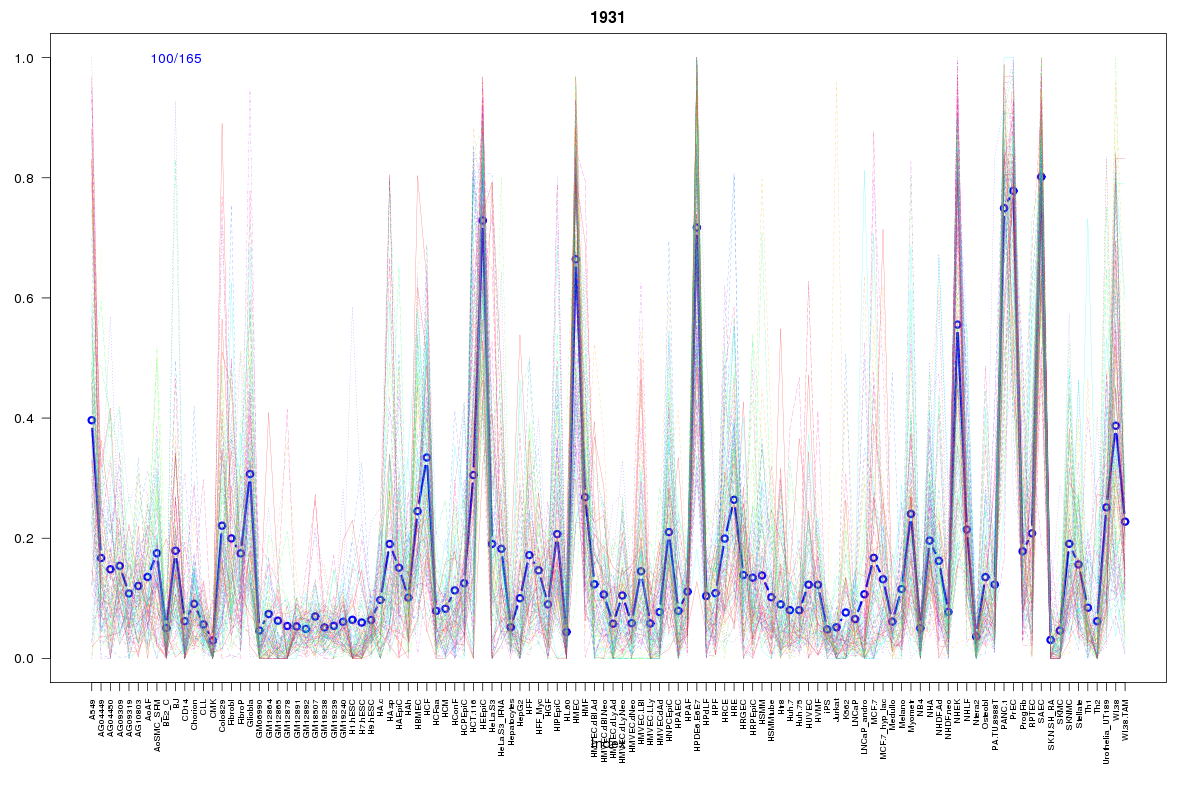
Cluster Hypersensitivity Profile

Genomic Location Trend
These plots show the distribution of the DHS sites surrounding the Transcript Start Site of the nearest gene.
Stats
Number of sites: 165Promoter: 6%
CpG-Island: 0%
Conserved: 34%
Enriched Motifs & Matches
Match Detail: [Jaspar]
|
| ||
|---|---|---|
| Sites: 44/100 | e-val: 0.000000000022 | ||
| Factor | e-val(match) | DB |
| AP1 | 0.00000000010468 | JASPAR |
| NFE2L2 | 0.0000000054525 | JASPAR |
| PPARG | 0.0043675 | JASPAR |
| NFE2L1::MafG | 0.0044637 | JASPAR |
| PBX1 | 0.012761 | JASPAR |
BED file downloads
Top 10 Example Regions
| Location | Gene Link | Dist. |
|---|---|---|
| chr16: 1741260-1741410 | IGFALS | 49.29 |
| chr16: 1741260-1741410 | HN1L | 49.29 |
| chr5: 150637540-150637690 | SLC36A2 | 54.32 |
| chr5: 150637540-150637690 | GM2A | 54.32 |
| chr17: 76501560-76501710 | PGS1 | 54.32 |
| chr17: 48105305-48105455 | ITGA3 | 56.93 |
| chr17: 48105305-48105455 | RP11-1094H24.4 | 56.93 |
| chr22: 30390080-30390230 | MTMR3 | 63.61 |
| chr9: 123391500-123391650 | MEGF9 | 64.34 |
| chr1: 24610680-24610830 | STPG1 | 69.02 |