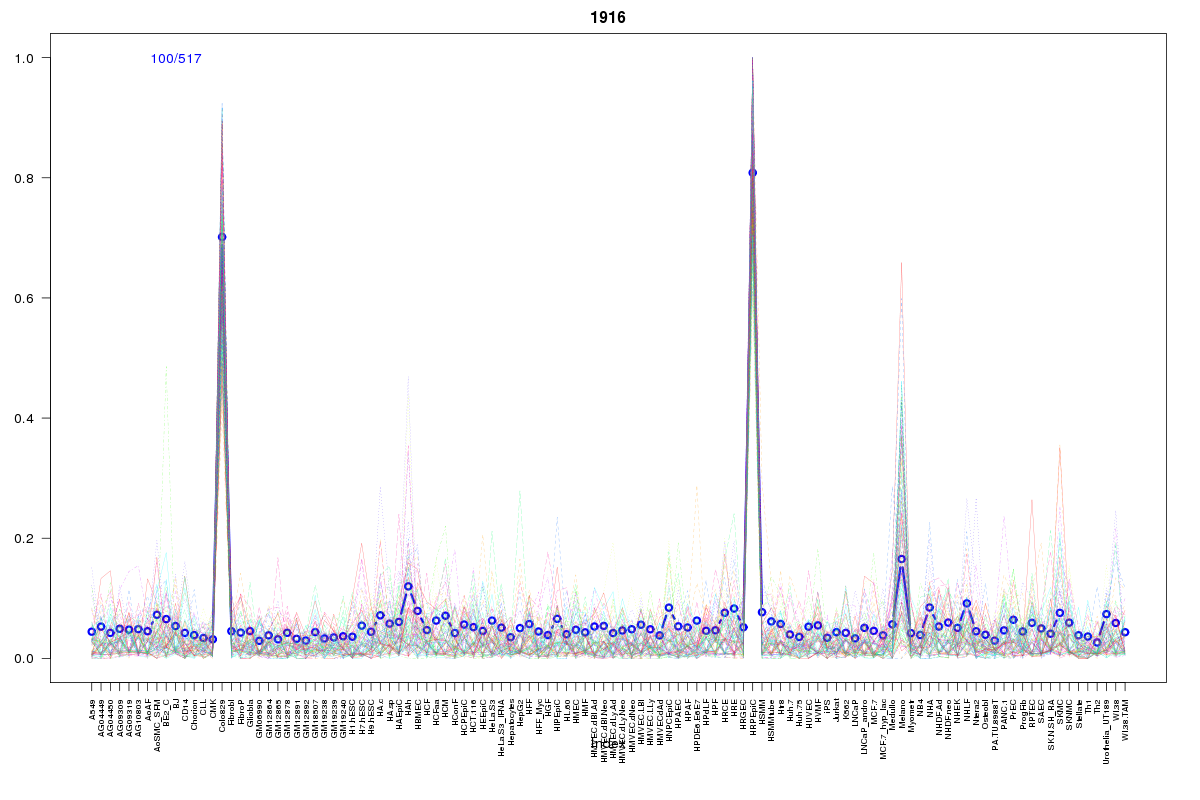
SOM cluster: 1916
Cluster Hypersensitivity Profile

Genomic Location Trend
These plots show the distribution of the DHS sites surrounding the Transcript Start Site of the nearest gene.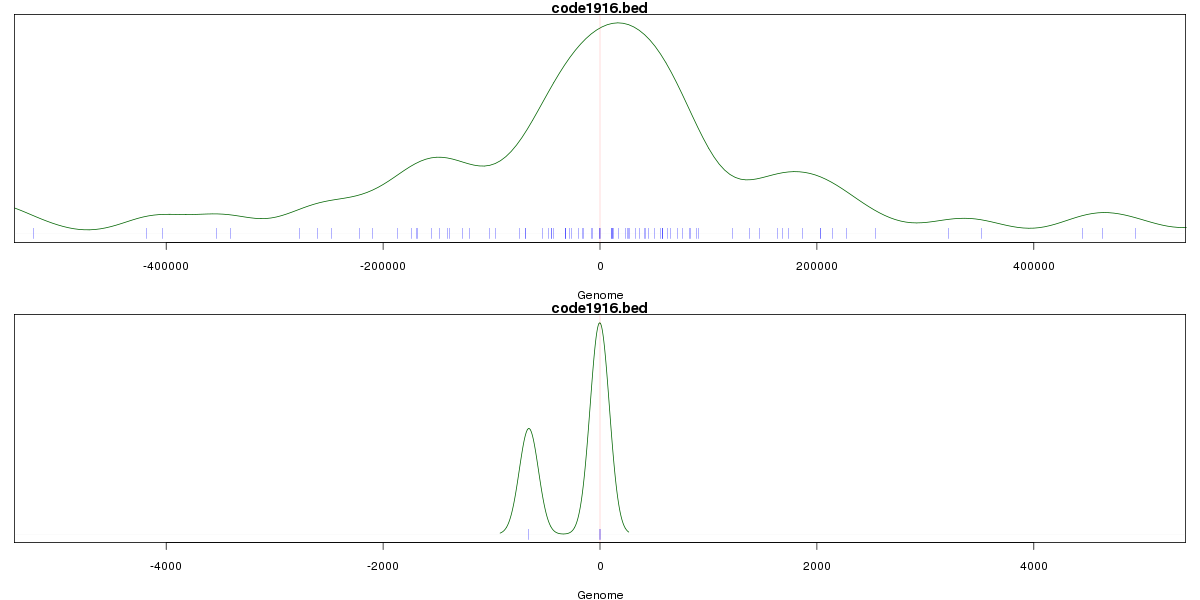
Stats
Number of sites: 517Promoter: 3%
CpG-Island: 0%
Conserved: 55%
Enriched Motifs & Matches
Match Detail: [Jaspar]
|
| ||
|---|---|---|
| Sites: 47/100 | e-val: 0.000000000000082 | ||
| Factor | e-val(match) | DB |
| SOX10 | 0.0000074796 | JASPAR |
| Foxd3 | 0.0021261 | JASPAR |
| Foxq1 | 0.013893 | JASPAR |
| MEF2A | 0.022991 | JASPAR |
| RORA_1 | 0.024147 | JASPAR |
BED file downloads
Top 10 Example Regions
| Location | Gene Link | Dist. |
|---|---|---|
| chr15: 89667760-89667910 | RLBP1 | 58.1 |
| chr4: 90828060-90828210 | SNCA | 59.83 |
| chr3: 183724560-183724710 | ABCC5 | 61.17 |
| chr1: 216143880-216144030 | RP5-1111A8.3 | 62.72 |
| chr3: 139251960-139252110 | RBP1 | 67.14 |
| chr1: 103576220-103576370 | COL11A1 | 68.27 |
| chr2: 165833000-165833150 | SLC38A11 | 70.08 |
| chr3: 25521060-25521210 | RARB | 72.24 |
| chr2: 133687460-133687610 | NCKAP5 | 72.81 |
| chr13: 95131940-95132090 | DCT | 72.95 |