SOM cluster: 191
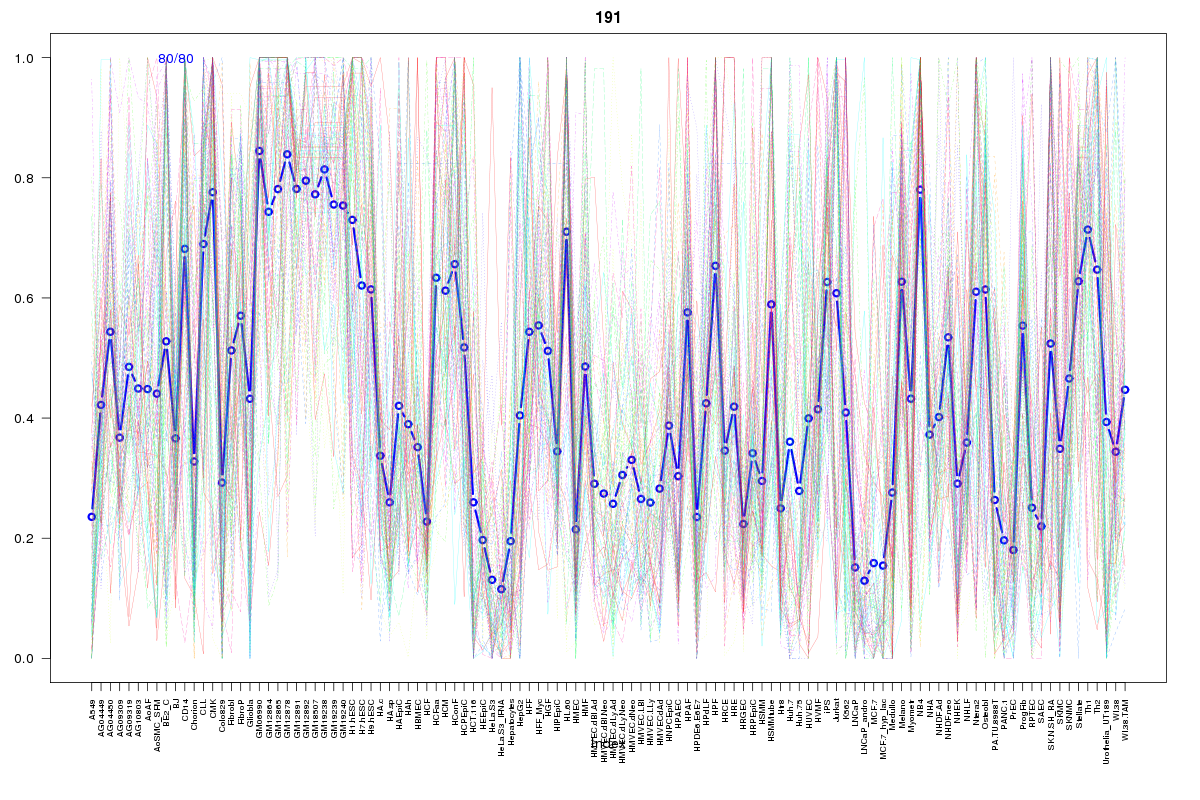
Cluster Hypersensitivity Profile

Genomic Location Trend
These plots show the distribution of the DHS sites surrounding the Transcript Start Site of the nearest gene.
Stats
Number of sites: 80Promoter: 22%
CpG-Island: 21%
Conserved: 50%
Enriched Motifs & Matches
Match Detail: [Jaspar]
|
| ||
|---|---|---|
| Sites: 72/80 | e-val: 5.49996e-41 | ||
| Factor | e-val(match) | DB |
| SP1 | 0.000000000020029 | JASPAR |
| Pax4 | 0.00021761 | JASPAR |
| PLAG1 | 0.00096141 | JASPAR |
| RREB1 | 0.0014147 | JASPAR |
| Klf4 | 0.0043693 | JASPAR |
|
| ||
| Sites: 56/80 | e-val: 1.7e-19 | ||
| Factor | e-val(match) | DB |
| TFAP2A | 0.0077835 | JASPAR |
| Myf | 0.0081957 | JASPAR |
| TP53 | 0.029927 | JASPAR |
| NHLH1 | 0.11488 | JASPAR |
| ELK4 | 0.11673 | JASPAR |
|
| ||
| Sites: 31/80 | e-val: 0.00084 | ||
| Factor | e-val(match) | DB |
| SP1 | 0.000013146 | JASPAR |
| SPIB | 0.000086497 | JASPAR |
| EWSR1-FLI1 | 0.0005641 | JASPAR |
| Pax4 | 0.00091396 | JASPAR |
| SPI1 | 0.00095085 | JASPAR |
BED file downloads
Top 10 Example Regions
| Location | Gene Link | Dist. |
|---|---|---|
| chr8: 38627680-38627830 | Y_RNA | 37.37 |
| chr9: 117150280-117150430 | RP11-9M16.2 | 57.16 |
| chr9: 117150280-117150430 | DFNB31 | 57.16 |
| chr9: 117150280-117150430 | AKNA | 57.16 |
| chr9: 117150280-117150430 | ORM1 | 57.16 |
| chr14: 24564800-24564950 | RP11-468E2.6 | 58.4 |
| chr14: 24564800-24564950 | PCK2 | 58.4 |
| chr14: 24564800-24564950 | RP11-468E2.5 | 58.4 |
| chr2: 64834260-64834410 | SERTAD2 | 64.67 |
| chr2: 64834260-64834410 | AFTPH | 64.67 |