SOM cluster: 1885
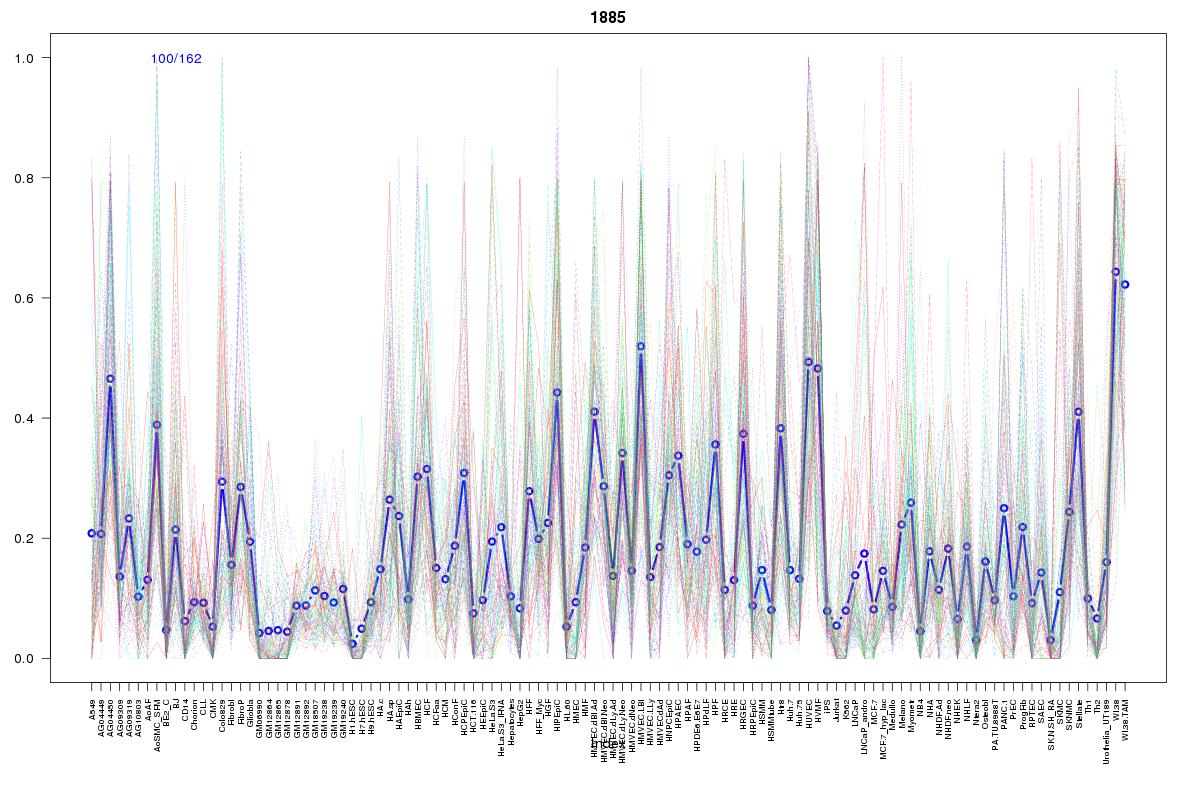
Cluster Hypersensitivity Profile

Genomic Location Trend
These plots show the distribution of the DHS sites surrounding the Transcript Start Site of the nearest gene.
Stats
Number of sites: 162Promoter: 0%
CpG-Island: 0%
Conserved: 35%
Enriched Motifs & Matches
Match Detail: [Jaspar]
|
| ||
|---|---|---|
| Sites: 72/100 | e-val: 7.6e-34 | ||
| Factor | e-val(match) | DB |
| Foxa2 | 0.000000001286 | JASPAR |
| FOXA1 | 0.000000015317 | JASPAR |
| FOXO3 | 0.000000087759 | JASPAR |
| FOXD1 | 0.000006697 | JASPAR |
| Foxq1 | 0.000026216 | JASPAR |
BED file downloads
Top 10 Example Regions
| Location | Gene Link | Dist. |
|---|---|---|
| chr12: 77510120-77510270 | E2F7 | 49.01 |
| chr11: 43945020-43945170 | RP11-613D13.8 | 63.53 |
| chr14: 61091920-61092070 | SIX4 | 66.11 |
| chr14: 61091920-61092070 | RP11-1042B17.2 | 66.11 |
| chr14: 61091920-61092070 | RP11-1042B17.1 | 66.11 |
| chr2: 66743020-66743170 | MEIS1 | 70.67 |
| chr13: 111077620-111077770 | COL4A2 | 72.25 |
| chr14: 51283280-51283430 | NIN | 74.31 |
| chr11: 124185060-124185210 | OR8D2 | 74.44 |
| chr10: 105656060-105656210 | SLK | 74.53 |