SOM cluster: 1882
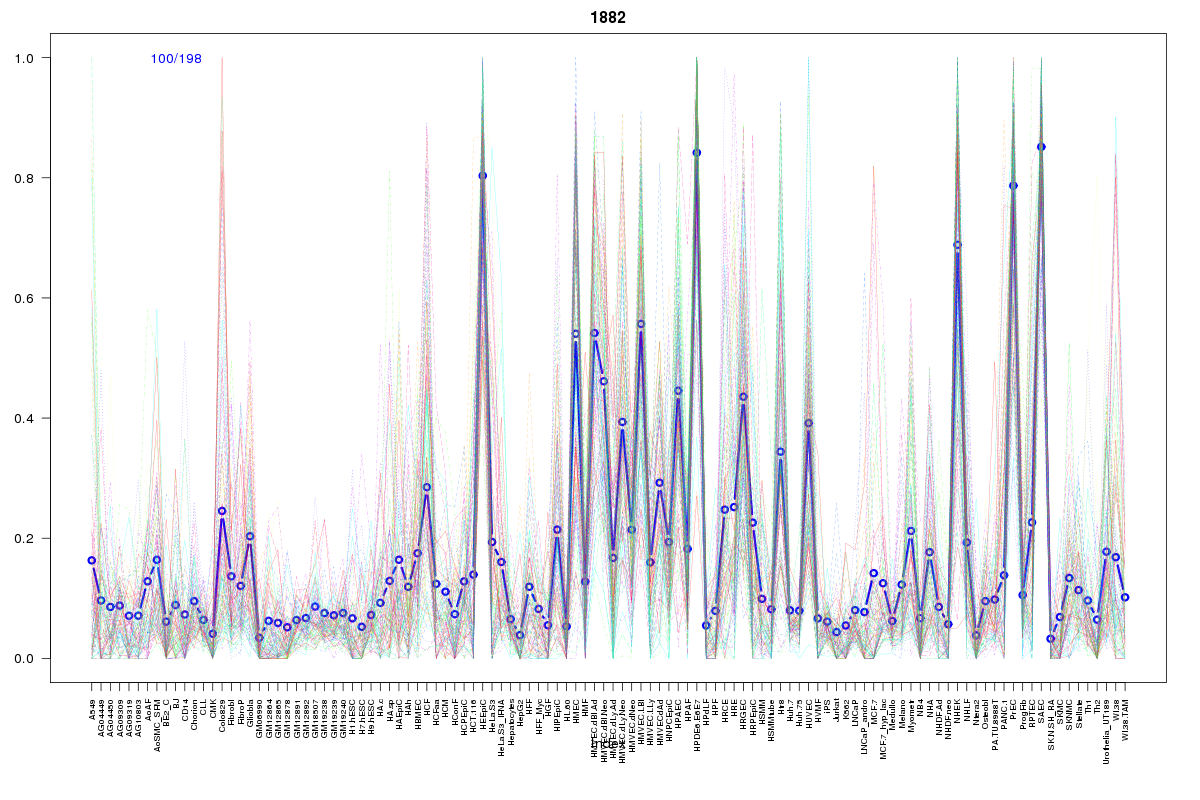
Cluster Hypersensitivity Profile

Genomic Location Trend
These plots show the distribution of the DHS sites surrounding the Transcript Start Site of the nearest gene.
Stats
Number of sites: 198Promoter: 1%
CpG-Island: 0%
Conserved: 32%
Enriched Motifs & Matches
Match Detail: [Jaspar]
|
| ||
|---|---|---|
| Sites: 45/100 | e-val: 0.000000000019 | ||
| Factor | e-val(match) | DB |
| AP1 | 0.00000092416 | JASPAR |
| NFE2L2 | 0.0000041994 | JASPAR |
| SOX10 | 0.0024161 | JASPAR |
| Sox2 | 0.014974 | JASPAR |
| NFE2L1::MafG | 0.018582 | JASPAR |
BED file downloads
Top 10 Example Regions
| Location | Gene Link | Dist. |
|---|---|---|
| chr10: 82173480-82173630 | TSPAN14 | 41.48 |
| chr10: 82173480-82173630 | FAM213A | 41.48 |
| chr12: 110741960-110742110 | ATP2A2 | 56.2 |
| chr3: 171961960-171962110 | FNDC3B | 65.1 |
| chr1: 61900000-61900150 | NFIA | 67.39 |
| chr13: 99561420-99561570 | DOCK9 | 70.52 |
| chr1: 62072340-62072490 | RP11-430G17.1 | 71.18 |
| chr4: 87766920-87767070 | C4orf36 | 71.82 |
| chr18: 21418800-21418950 | LAMA3 | 73.41 |
| chr21: 39855840-39855990 | ERG | 73.49 |