SOM cluster: 1874
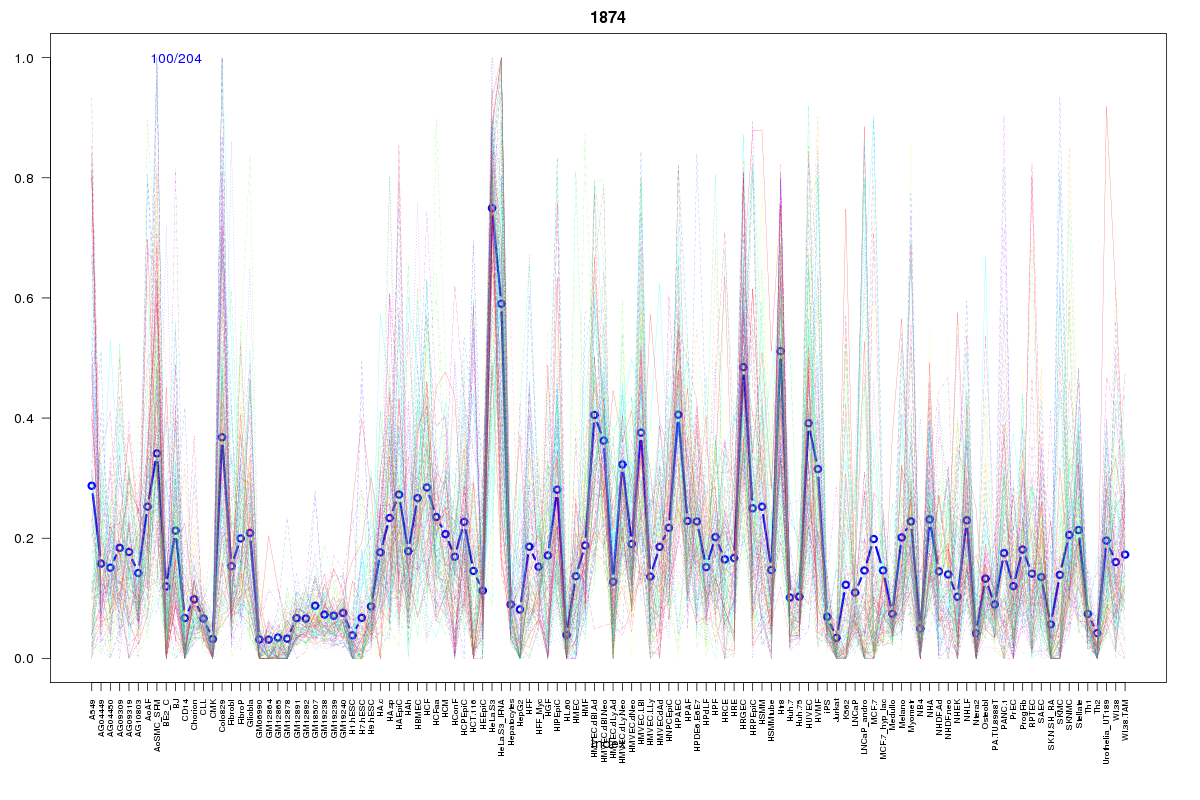
Cluster Hypersensitivity Profile

Genomic Location Trend
These plots show the distribution of the DHS sites surrounding the Transcript Start Site of the nearest gene.
Stats
Number of sites: 204Promoter: 1%
CpG-Island: 0%
Conserved: 57%
Enriched Motifs & Matches
Match Detail: [Jaspar]
|
| ||
|---|---|---|
| Sites: 40/100 | e-val: 0.00000016 | ||
| Factor | e-val(match) | DB |
| Foxd3 | 0.0002248 | JASPAR |
| ARID3A | 0.0011611 | JASPAR |
| Prrx2 | 0.0013244 | JASPAR |
| MEF2A | 0.0020196 | JASPAR |
| Nkx2-5 | 0.0020942 | JASPAR |
|
| ||
| Sites: 28/100 | e-val: 0.00041 | ||
| Factor | e-val(match) | DB |
| NFE2L2 | 0.00000000095682 | JASPAR |
| AP1 | 0.0000000011791 | JASPAR |
| NFE2L1::MafG | 0.00010631 | JASPAR |
| Pax2 | 0.0073747 | JASPAR |
| PBX1 | 0.011338 | JASPAR |
BED file downloads
Top 10 Example Regions
| Location | Gene Link | Dist. |
|---|---|---|
| chr3: 151692000-151692150 | SUCNR1 | 52.21 |
| chr4: 11743080-11743230 | RP11-281P23.2 | 52.71 |
| chr2: 180137180-180137330 | SESTD1 | 55.32 |
| chrX: 10125720-10125870 | WWC3 | 58.11 |
| chr9: 35026300-35026450 | RN7SL338P | 59.27 |
| chr17: 42301280-42301430 | U3 | 64.73 |
| chr3: 171858920-171859070 | FNDC3B | 65.26 |
| chr3: 171858920-171859070 | RN7SL141P | 65.26 |
| chr11: 29041940-29042090 | RP11-115J23.1 | 65.75 |
| chr3: 25499680-25499830 | RARB | 65.8 |