SOM cluster: 187
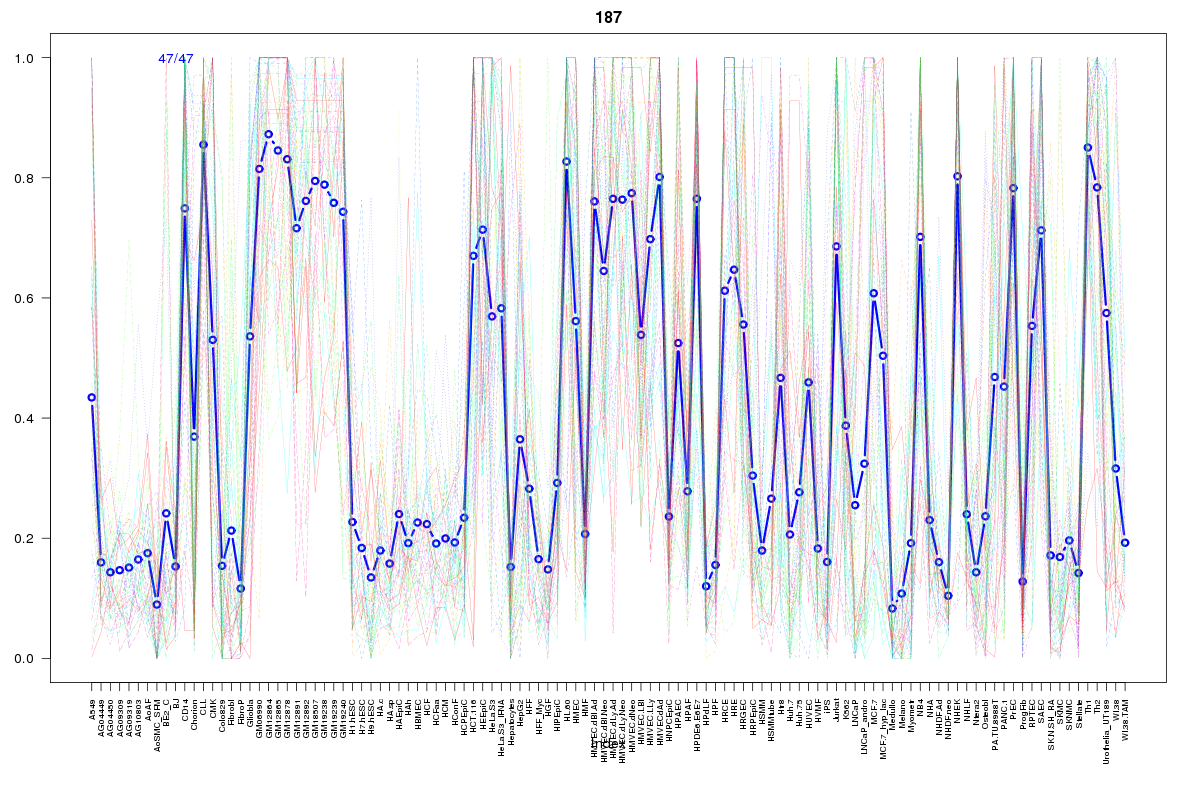
Cluster Hypersensitivity Profile

Genomic Location Trend
These plots show the distribution of the DHS sites surrounding the Transcript Start Site of the nearest gene.
Stats
Number of sites: 47Promoter: 21%
CpG-Island: 2%
Conserved: 27%
Enriched Motifs & Matches
Match Detail: [Jaspar]
|
| ||
|---|---|---|
| Sites: 25/47 | e-val: 0.000000005 | ||
| Factor | e-val(match) | DB |
| NFE2L2 | 0.00000000000051825 | JASPAR |
| AP1 | 0.0000000076367 | JASPAR |
| PPARG | 0.003705 | JASPAR |
| Pax2 | 0.0076781 | JASPAR |
| ESR1 | 0.011173 | JASPAR |
|
| ||
| Sites: 30/47 | e-val: 0.000045 | ||
| Factor | e-val(match) | DB |
| SP1 | 0.0000044426 | JASPAR |
| Klf4 | 0.000019875 | JASPAR |
| RREB1 | 0.00016189 | JASPAR |
| Pax4 | 0.00093197 | JASPAR |
| Tcfcp2l1 | 0.005546 | JASPAR |
|
| ||
| Sites: 27/47 | e-val: 0.0036 | ||
| Factor | e-val(match) | DB |
| FEV | 0.000000000075319 | JASPAR |
| SPI1 | 0.0000000003584 | JASPAR |
| GABPA | 0.0000000024227 | JASPAR |
| ELF5 | 0.00000033176 | JASPAR |
| ELK4 | 0.000001934 | JASPAR |
BED file downloads
Top 10 Example Regions
| Location | Gene Link | Dist. |
|---|---|---|
| chr11: 65849100-65849250 | GAL3ST3 | 38.05 |
| chr9: 139434220-139434370 | NOTCH1 | 38.08 |
| chr19: 16181205-16181355 | HSH2D | 50.72 |
| chr2: 64870480-64870630 | AFTPH | 74.21 |
| chr2: 64870480-64870630 | SERTAD2 | 74.21 |
| chr9: 129568140-129568290 | ZBTB43 | 77.77 |
| chr3: 172241180-172241330 | TNFSF10 | 83.53 |
| chr8: 27219740-27219890 | PTK2B | 88.74 |
| chr17: 76732920-76733070 | USP36 | 93.56 |
| chr17: 76732920-76733070 | CYTH1 | 93.56 |