SOM cluster: 1844
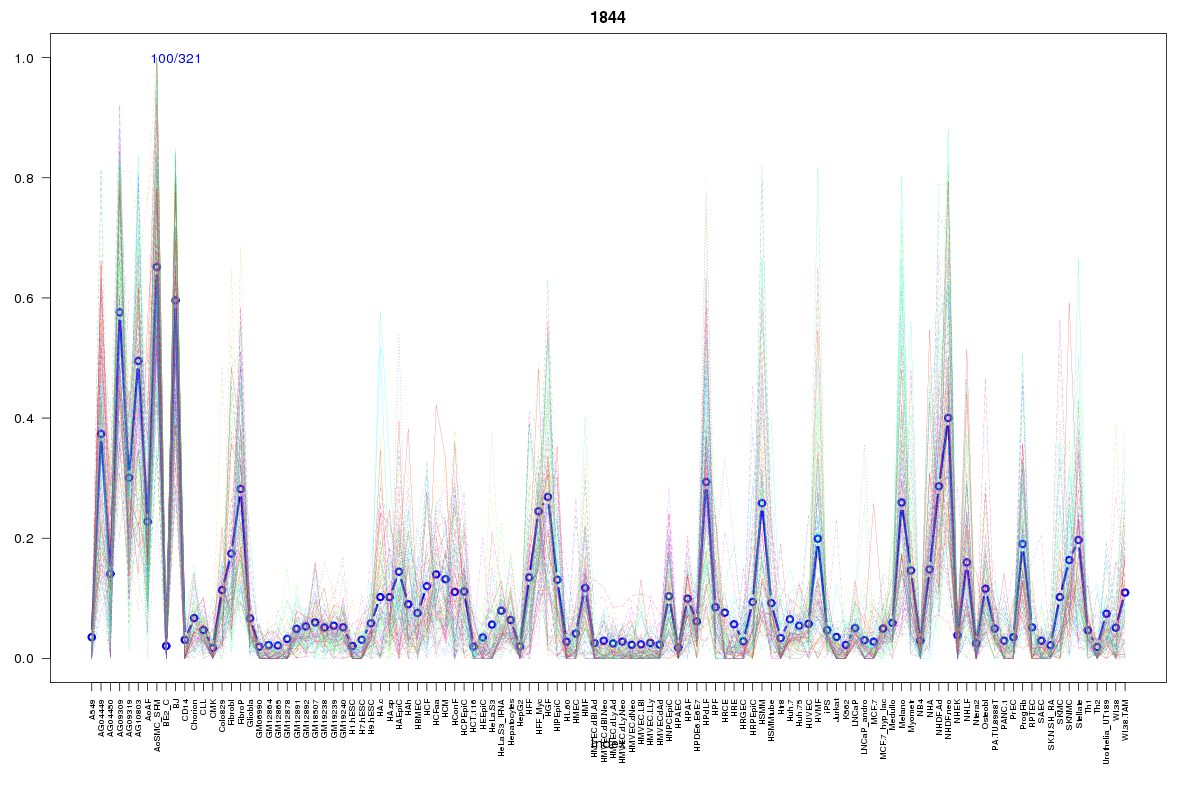
Cluster Hypersensitivity Profile

Genomic Location Trend
These plots show the distribution of the DHS sites surrounding the Transcript Start Site of the nearest gene.
Stats
Number of sites: 321Promoter: 1%
CpG-Island: 0%
Conserved: 56%
Enriched Motifs & Matches
Match Detail: [Jaspar]
|
| ||
|---|---|---|
| Sites: 55/100 | e-val: 0.0000000000000068 | ||
| Factor | e-val(match) | DB |
| Foxq1 | 0.00019213 | JASPAR |
| MEF2A | 0.0044202 | JASPAR |
| Foxd3 | 0.0054041 | JASPAR |
| FOXO3 | 0.0087406 | JASPAR |
| SOX10 | 0.038288 | JASPAR |
|
| ||
| Sites: 36/100 | e-val: 0.00000017 | ||
| Factor | e-val(match) | DB |
| TEAD1 | 0.0083004 | JASPAR |
| HNF1B | 0.0098244 | JASPAR |
| SOX9 | 0.017821 | JASPAR |
| BRCA1 | 0.022388 | JASPAR |
| Foxq1 | 0.027413 | JASPAR |
|
| ||
| Sites: 20/100 | e-val: 1.4 | ||
| Factor | e-val(match) | DB |
| RELA | 0.00000097059 | JASPAR |
| NF-kappaB | 0.000019696 | JASPAR |
| TEAD1 | 0.00008677 | JASPAR |
| REL | 0.00024519 | JASPAR |
| NFATC2 | 0.00047419 | JASPAR |
BED file downloads
Top 10 Example Regions
| Location | Gene Link | Dist. |
|---|---|---|
| chr3: 155109240-155109390 | PLCH1-AS1 | 38.76 |
| chr8: 120633760-120633910 | ENPP2 | 44.47 |
| chr3: 21489560-21489710 | ZNF385D | 46.82 |
| chr2: 173860300-173860450 | RAPGEF4 | 50.23 |
| chr1: 182547600-182547750 | RNASEL | 51.71 |
| chr11: 75165120-75165270 | SNORD15A | 51.88 |
| chr1: 41210960-41211110 | NFYC | 54.97 |
| chr6: 40921340-40921490 | UNC5CL | 56.12 |
| chr3: 33373060-33373210 | UBP1 | 59.1 |
| chrX: 122272460-122272610 | MRRFP1 | 59.2 |