SOM cluster: 1838
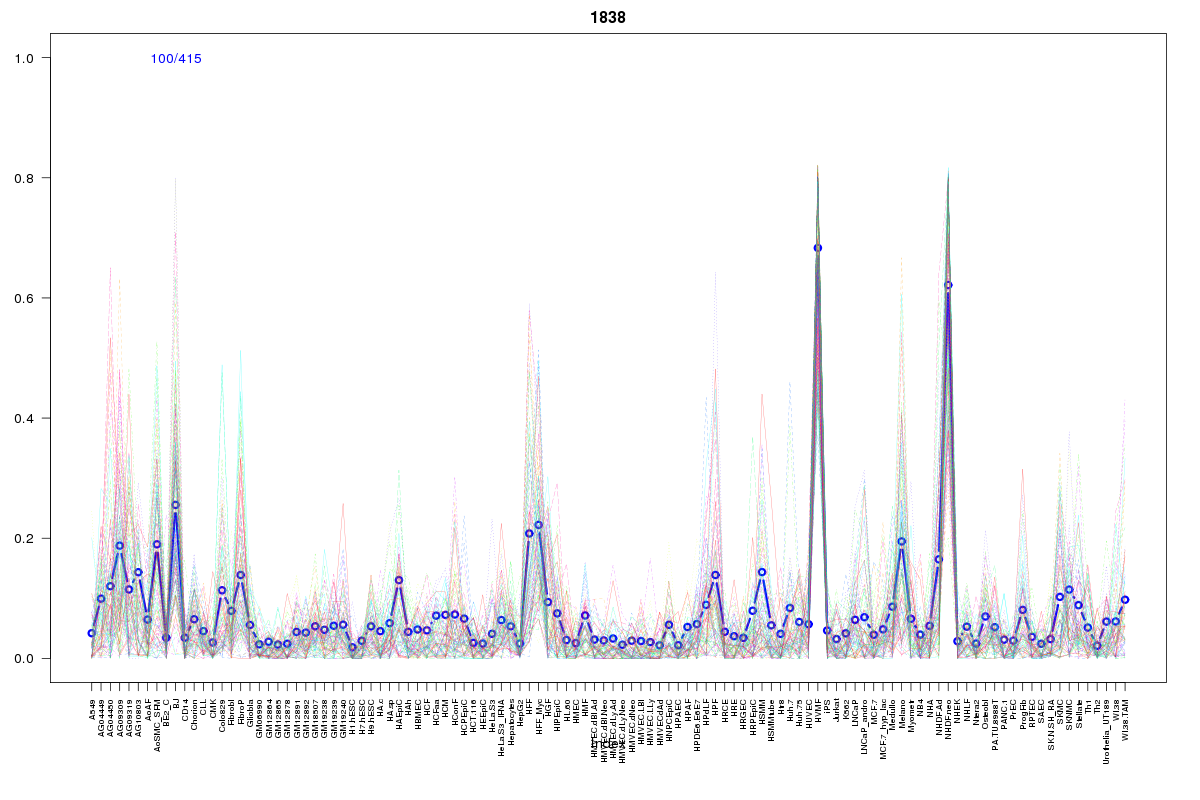
Cluster Hypersensitivity Profile

Genomic Location Trend
These plots show the distribution of the DHS sites surrounding the Transcript Start Site of the nearest gene.
Stats
Number of sites: 415Promoter: 1%
CpG-Island: 0%
Conserved: 41%
Enriched Motifs & Matches
Match Detail: [Jaspar]
|
| ||
|---|---|---|
| Sites: 25/100 | e-val: 0.00000013 | ||
| Factor | e-val(match) | DB |
| FOXD1 | 0.000035291 | JASPAR |
| FOXO3 | 0.000045259 | JASPAR |
| Foxq1 | 0.00052319 | JASPAR |
| Pax4 | 0.00075618 | JASPAR |
| Foxd3 | 0.0012169 | JASPAR |
BED file downloads
Top 10 Example Regions
| Location | Gene Link | Dist. |
|---|---|---|
| chr16: 11654940-11655090 | LITAF | 38.4 |
| chr2: 46606160-46606310 | TMEM247 | 61.02 |
| chr8: 97978160-97978310 | CPQ | 65.01 |
| chr7: 116857560-116857710 | WNT2 | 66.76 |
| chr6: 1325360-1325510 | FOXF2 | 70.61 |
| chr6: 1325360-1325510 | FOXQ1 | 70.61 |
| chr22: 45028560-45028710 | PRR5 | 77.93 |
| chr8: 11745500-11745650 | FDFT1 | 78.34 |
| chr4: 100305520-100305670 | ADH1B | 80.8 |
| chr1: 21778385-21778535 | NBPF3 | 81.77 |