SOM cluster: 1836
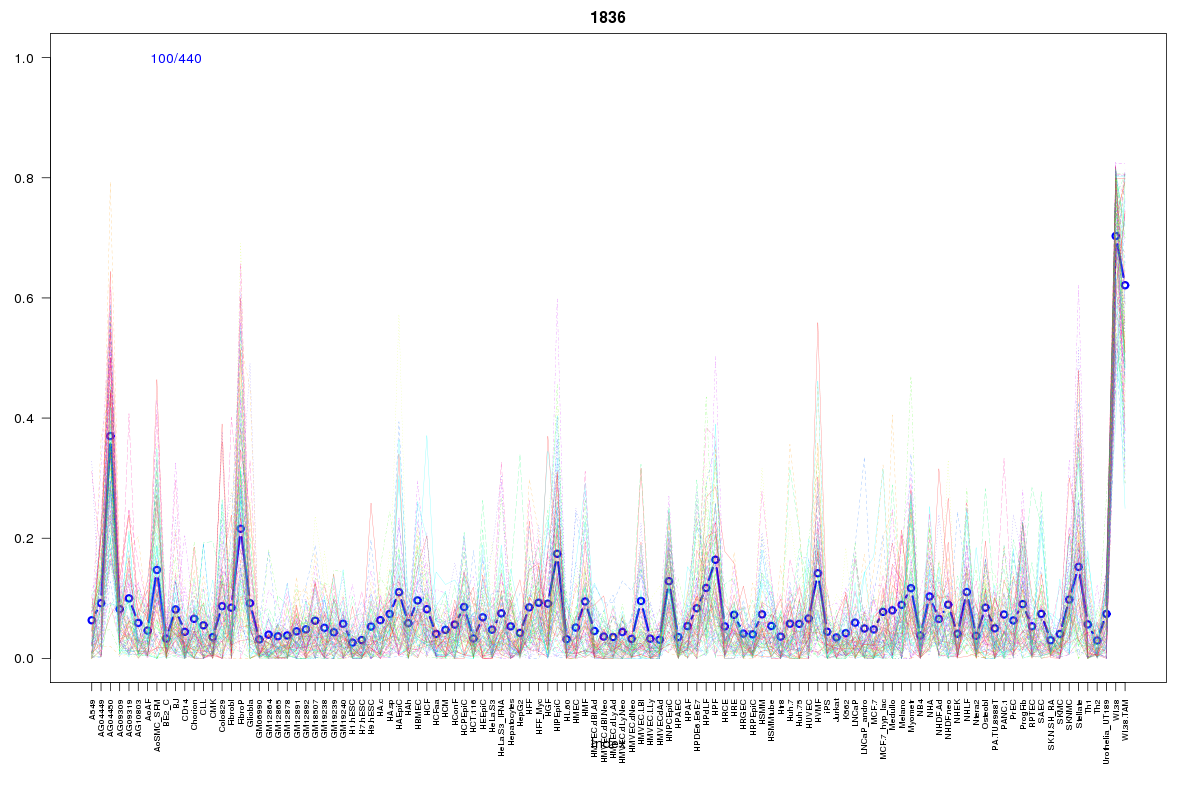
Cluster Hypersensitivity Profile

Genomic Location Trend
These plots show the distribution of the DHS sites surrounding the Transcript Start Site of the nearest gene.
Stats
Number of sites: 440Promoter: 1%
CpG-Island: 0%
Conserved: 23%
Enriched Motifs & Matches
Match Detail: [Jaspar]
|
| ||
|---|---|---|
| Sites: 40/100 | e-val: 0.0000000071 | ||
| Factor | e-val(match) | DB |
| FOXI1 | 0.000000000038343 | JASPAR |
| Foxq1 | 0.00000000029285 | JASPAR |
| Foxd3 | 0.0000000058677 | JASPAR |
| Foxa2 | 0.000000021649 | JASPAR |
| FOXA1 | 0.00000028136 | JASPAR |
|
| ||
| Sites: 21/100 | e-val: 0.2 | ||
| Factor | e-val(match) | DB |
| AP1 | 0.0000006552 | JASPAR |
| NFE2L2 | 0.0033378 | JASPAR |
| ARID3A | 0.0036332 | JASPAR |
| HNF1B | 0.0066069 | JASPAR |
| Prrx2 | 0.046977 | JASPAR |
BED file downloads
Top 10 Example Regions
| Location | Gene Link | Dist. |
|---|---|---|
| chr11: 15738260-15738410 | RP11-396O20.2 | 44.95 |
| chr17: 70096160-70096310 | SOX9 | 47.65 |
| chr2: 75474020-75474170 | TACR1 | 49.09 |
| chr6: 34181660-34181810 | RP11-513I15.6 | 52.92 |
| chr20: 49269480-49269630 | RP4-530I15.6 | 55.64 |
| chr2: 153481420-153481570 | ARL6IP6 | 58.09 |
| chr13: 32709780-32709930 | FRY | 59.69 |
| chr1: 178619200-178619350 | PTPN2P1 | 61.38 |
| chr1: 178619200-178619350 | RALGPS2 | 61.38 |
| chr2: 208119825-208119975 | AC007879.2 | 61.38 |