SOM cluster: 1832
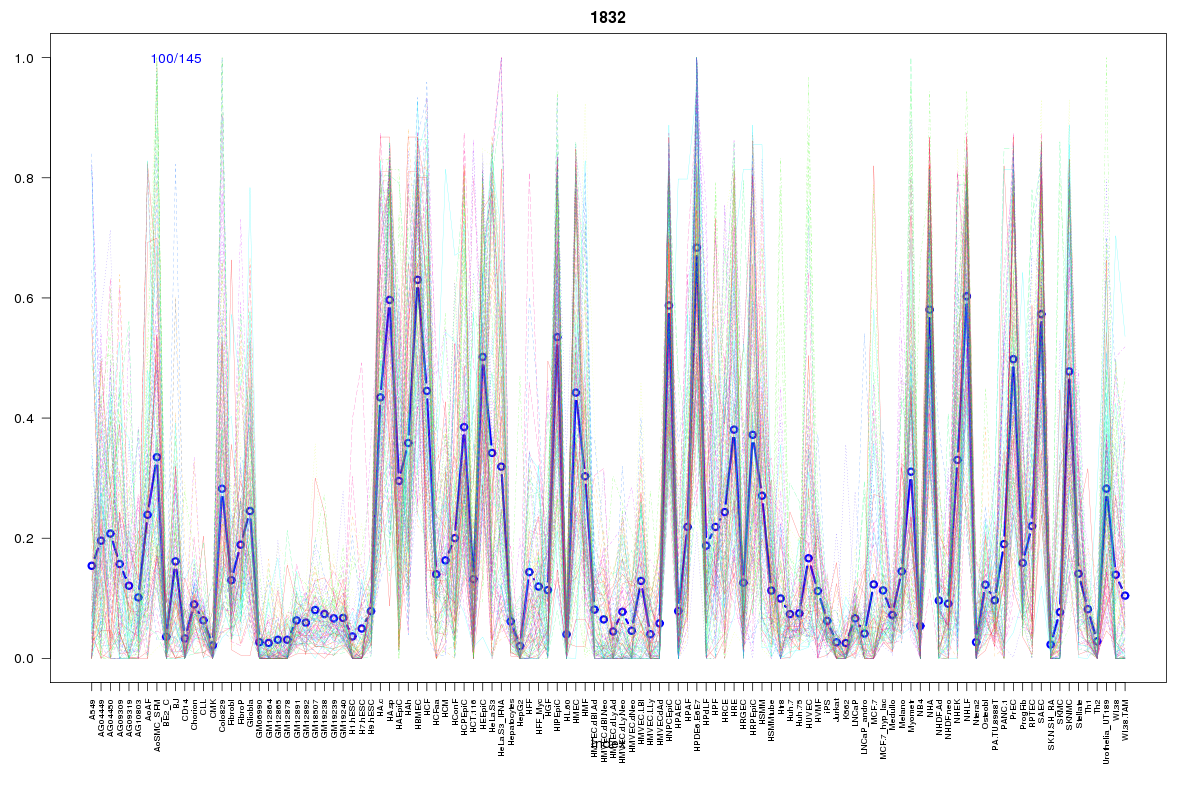
Cluster Hypersensitivity Profile

Genomic Location Trend
These plots show the distribution of the DHS sites surrounding the Transcript Start Site of the nearest gene.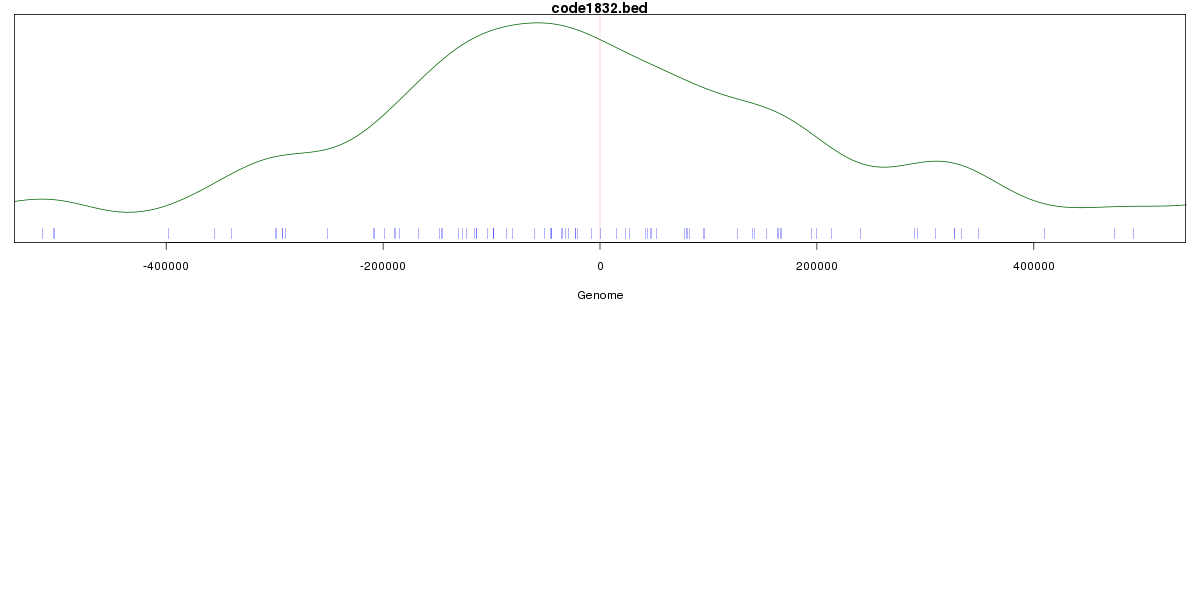
Stats
Number of sites: 145Promoter: 1%
CpG-Island: 0%
Conserved: 31%
Enriched Motifs & Matches
Match Detail: [Jaspar]
|
| ||
|---|---|---|
| Sites: 63/100 | e-val: 6.8e-31 | ||
| Factor | e-val(match) | DB |
| AP1 | 0.00000041152 | JASPAR |
| NFE2L2 | 0.000001372 | JASPAR |
| NFE2L1::MafG | 0.0036275 | JASPAR |
| Pax2 | 0.066612 | JASPAR |
| PBX1 | 0.14517 | JASPAR |
BED file downloads
Top 10 Example Regions
| Location | Gene Link | Dist. |
|---|---|---|
| chr8: 15440180-15440330 | TUSC3 | 35.16 |
| chr17: 65427520-65427670 | RN7SL756P | 46.56 |
| chr5: 76428845-76428995 | ZBED3 | 52.15 |
| chr15: 74494100-74494250 | STRA6 | 56.7 |
| chr7: 42035960-42036110 | GLI3 | 57.19 |
| chr7: 90208425-90208575 | CDK14 | 72.2 |
| chr7: 90208425-90208575 | CLDN12 | 72.2 |
| chr11: 37807900-37808050 | RPL7AP56 | 73.17 |
| chr6: 45585280-45585430 | RUNX2 | 75.42 |
| chr14: 28984900-28985050 | EIF4A1P12 | 76.72 |